WORKFLOW ANALYTICS
See every step across every app.
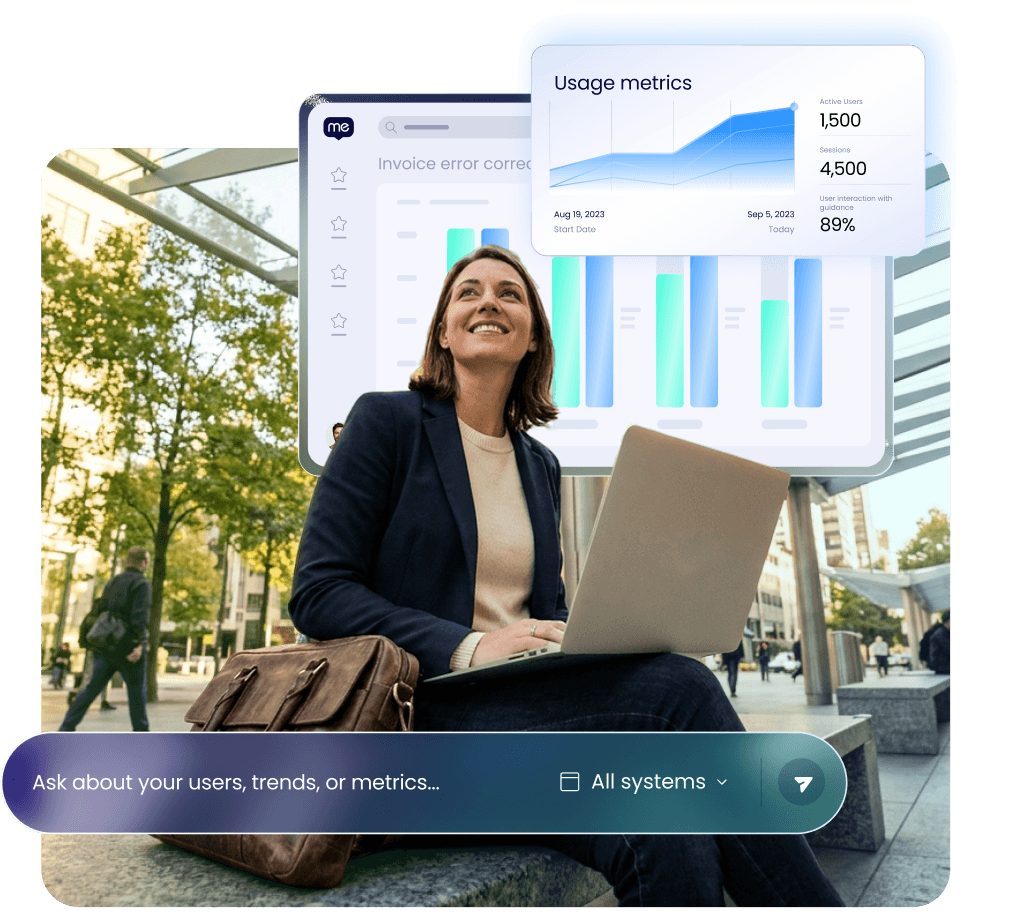
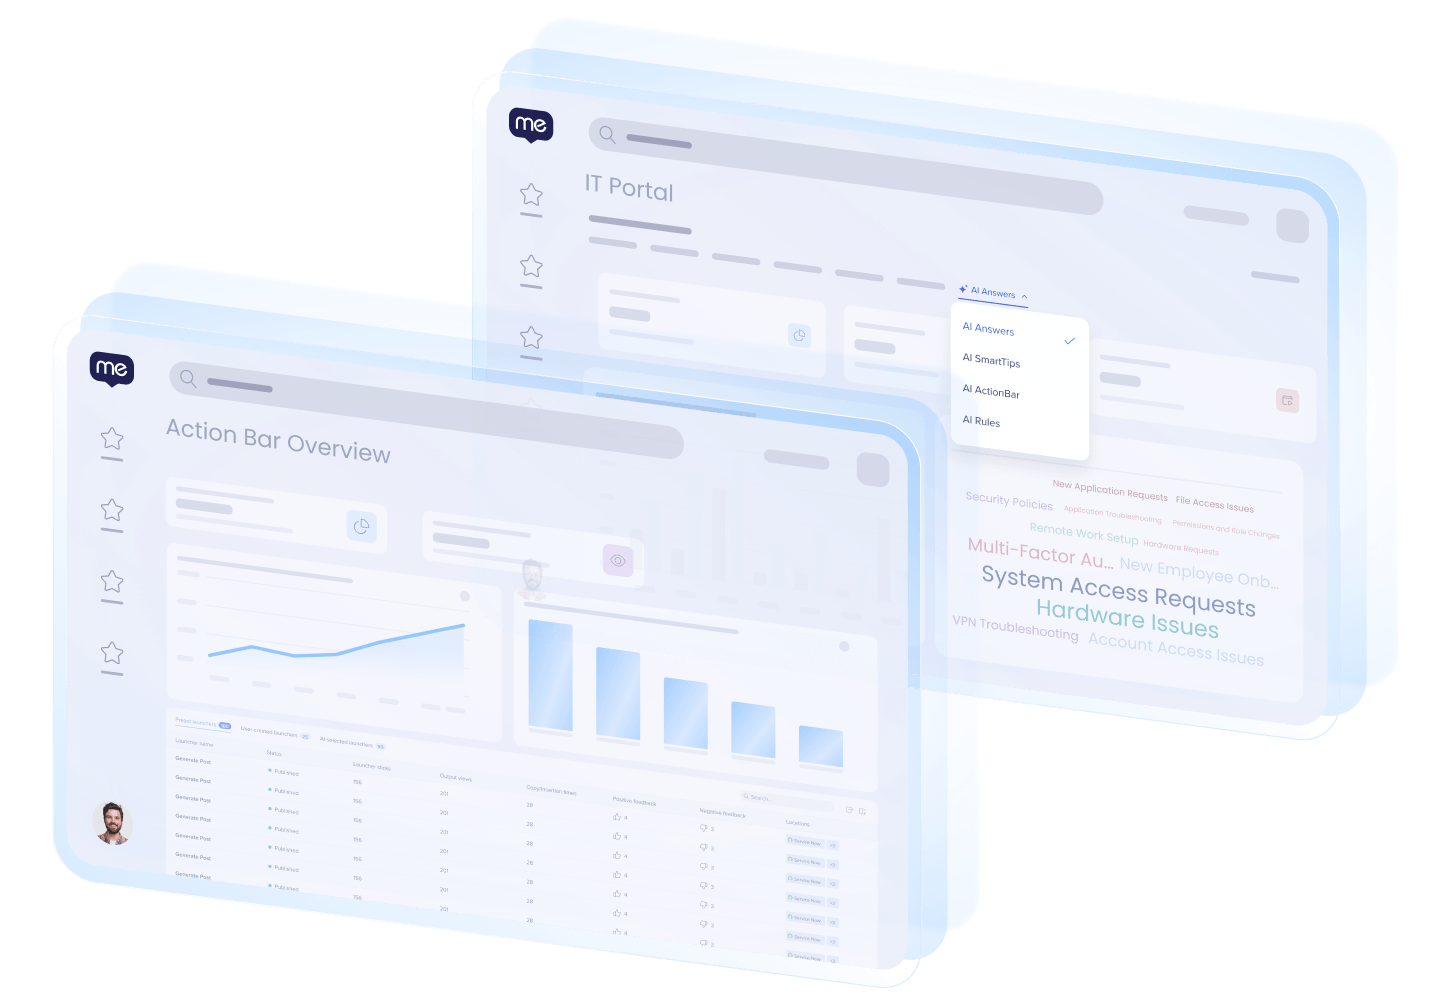
Pinpoint where people get stuck across every application and process. Ask any question to understand why, target the right fix, and make sure your workflows run the way you intended. Fewer errors, less friction, higher completion rates.
AI INSIGHTS
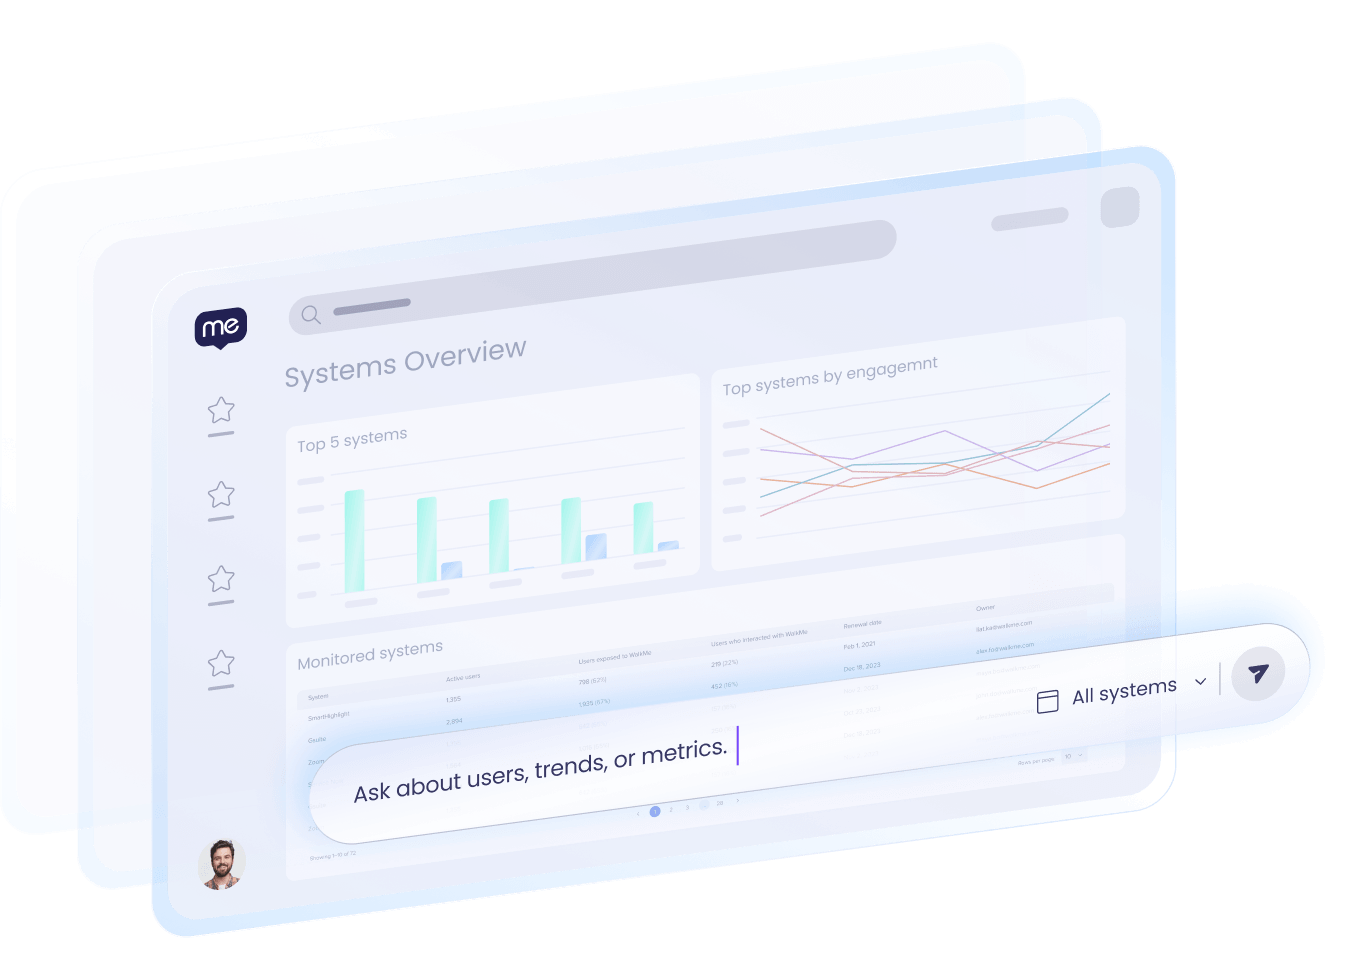
Ask anything about your workflow, in plain language.
Where are people getting stuck? How does adoption compare across teams? What’s actually driving ROI? Just ask and get instant insights you can act on, and charts you can save for reuse and easy sharing of outcomes and impact.
FLOW ANALYTICS
See how work actually flows.
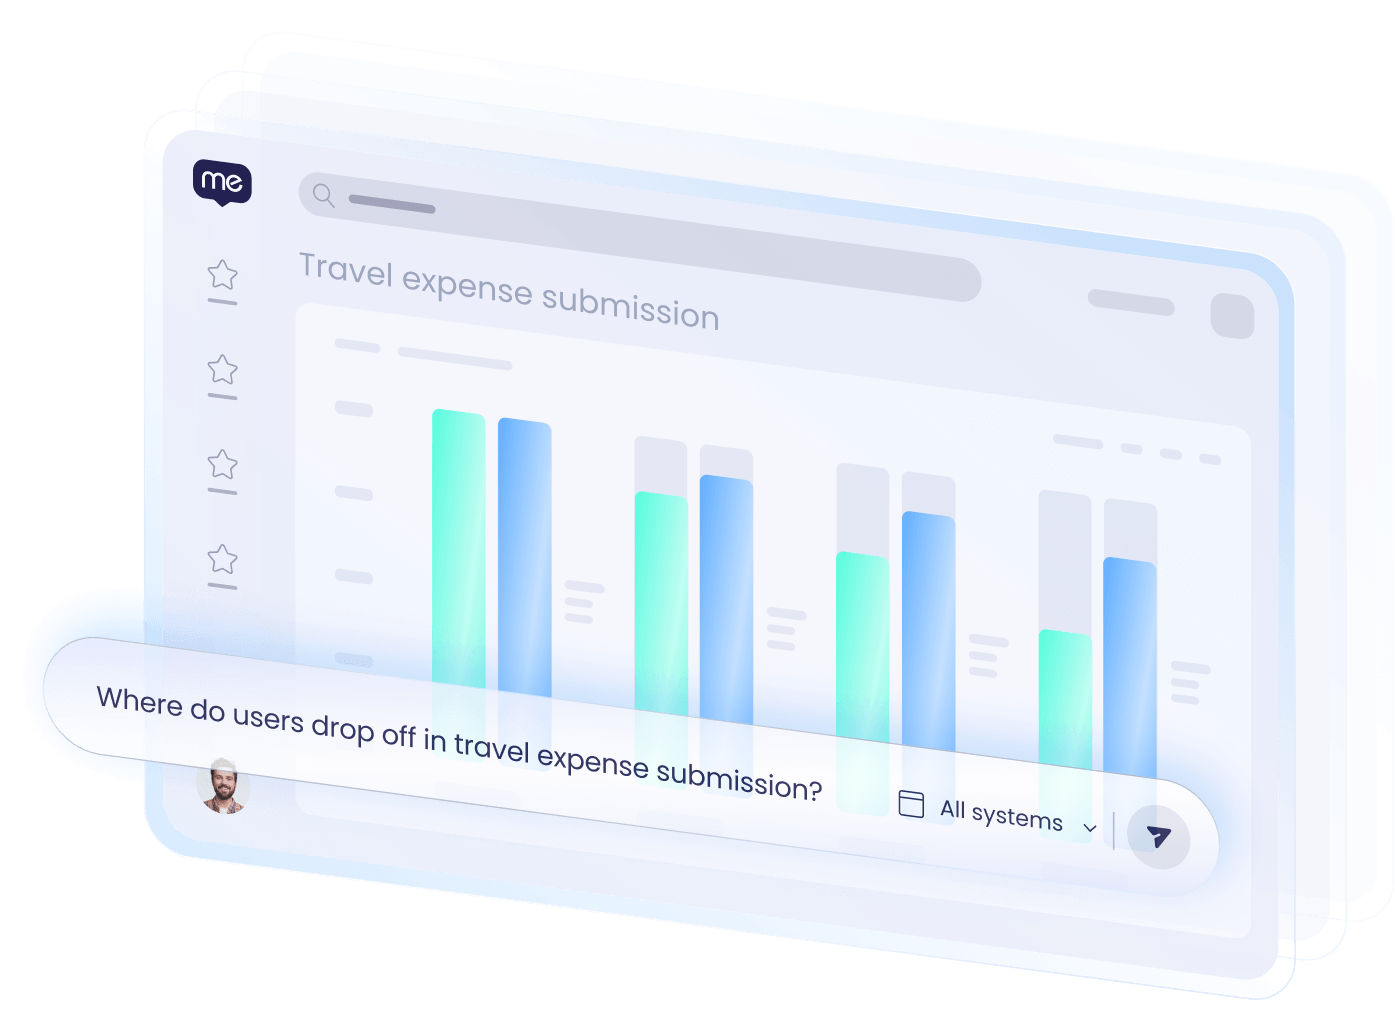
Every path users take through a workflow, mapped. See every click, every drop-off, every stall. Pinpoint exactly where a process breaks down, target the right fix, for the right users, and compare with vs. without WalkMe to prove impact.
CUSTOM DASHBOARDS & REPORTS
Prove progress to every stakeholder.
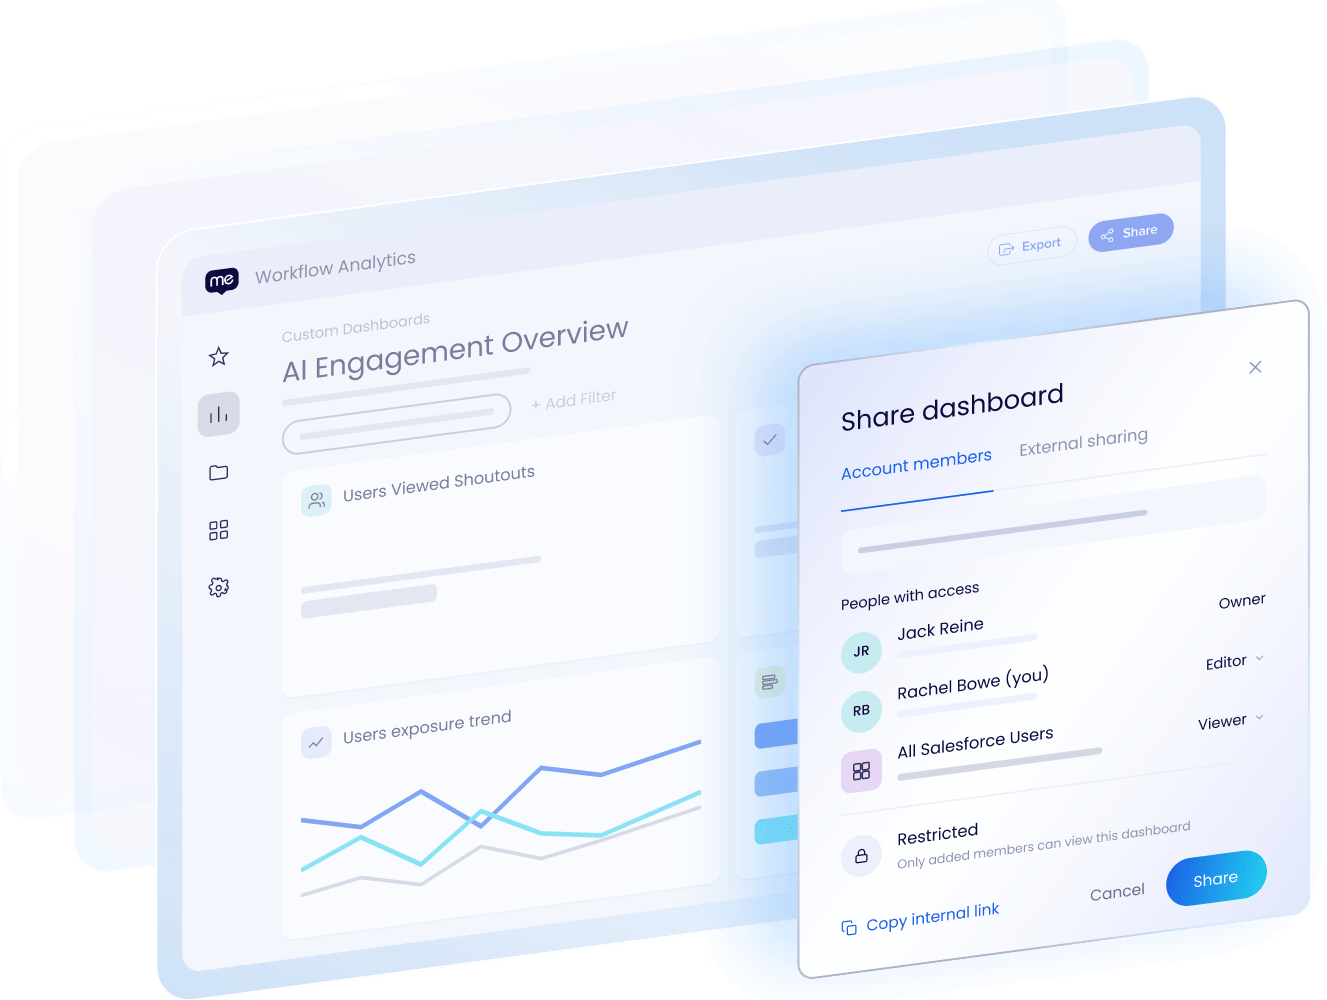
Build a dashboard for every KPI you’re reporting on, tailored to each stakeholder’s needs: program ROI for leadership, step-level performance for system owners, exportable data for broader reporting. Everyone gets the insights they need without digging, so they can act faster.
AI ADOPTION VISIBILITY
Find out if your AI rollout is actually working.
Most organizations can’t tell whether employees are using the AI tools they’ve deployed. Now you can. Track any AI-enabled workflow, see who adopts the AI, and measure if new AI paths outperform, so you know where to invest.

“In just the last few months, we have been able to take 6 or 7 workflows and reduce them from 23 or 16 clicks to 4 or 3, and the impact on productivity, minimizing errors, and consultant happiness has been remarkable.”

Marieke Tucker
Global Operations Leader
“With WalkMe, we can now see where people are getting stuck in a process and fix it fast. It makes everything feel more connected and intentional.”

Dario Spina
Senior GTM Strategy Analyst,

“Each digital rollout can be assessed with WalkMe Insights, so we can understand the rate of progress and what additional support is needed.”
Shawn Nautel
Digital CX – Sales/Service Leader

“WalkMe Insights are helping us shift from assumptions to evidence. We can pinpoint exactly where the process supports the user and where it doesn’t. That’s enabling smarter decisions – whether it’s redesigning a step, reinforcing training, or removing complexity altogether.”
Dympna Connolly
Director Change Management, PGT Team, PepsiCo
Explore more from WalkMe.

WHITEPAPER
WalkMe delivers a 3-year 494% ROI
ASSESSMENT
Score your execution gap
REPORT
2026 State of Digital Adoption Report
Ready to see inside your workflows?
Track every step, across every application.