What is digital transformation?
Digital transformation (DX) is the process of using technology to create new ways of doing business. This can involve changing existing systems or building new ones, fundamentally altering how a company operates and delivers value to customers. It includes moving traditional tasks to digital formats and requires a cultural shift, encouraging the company to challenge old ways, try new things, and accept failures.

The goal is to enhance customer experiences, boost efficiency, and drive innovation. Digital transformation is a continuous process of adapting to new technologies and market changes, often involving rethinking and innovating business models to stay competitive.
Why is digital transformation important?
Companies are increasingly spending on digital transformation processes, with Gartner forecasting that worldwide IT spending will total $4.7 trillion in 2023.
But why is digital transformation seen as so important?
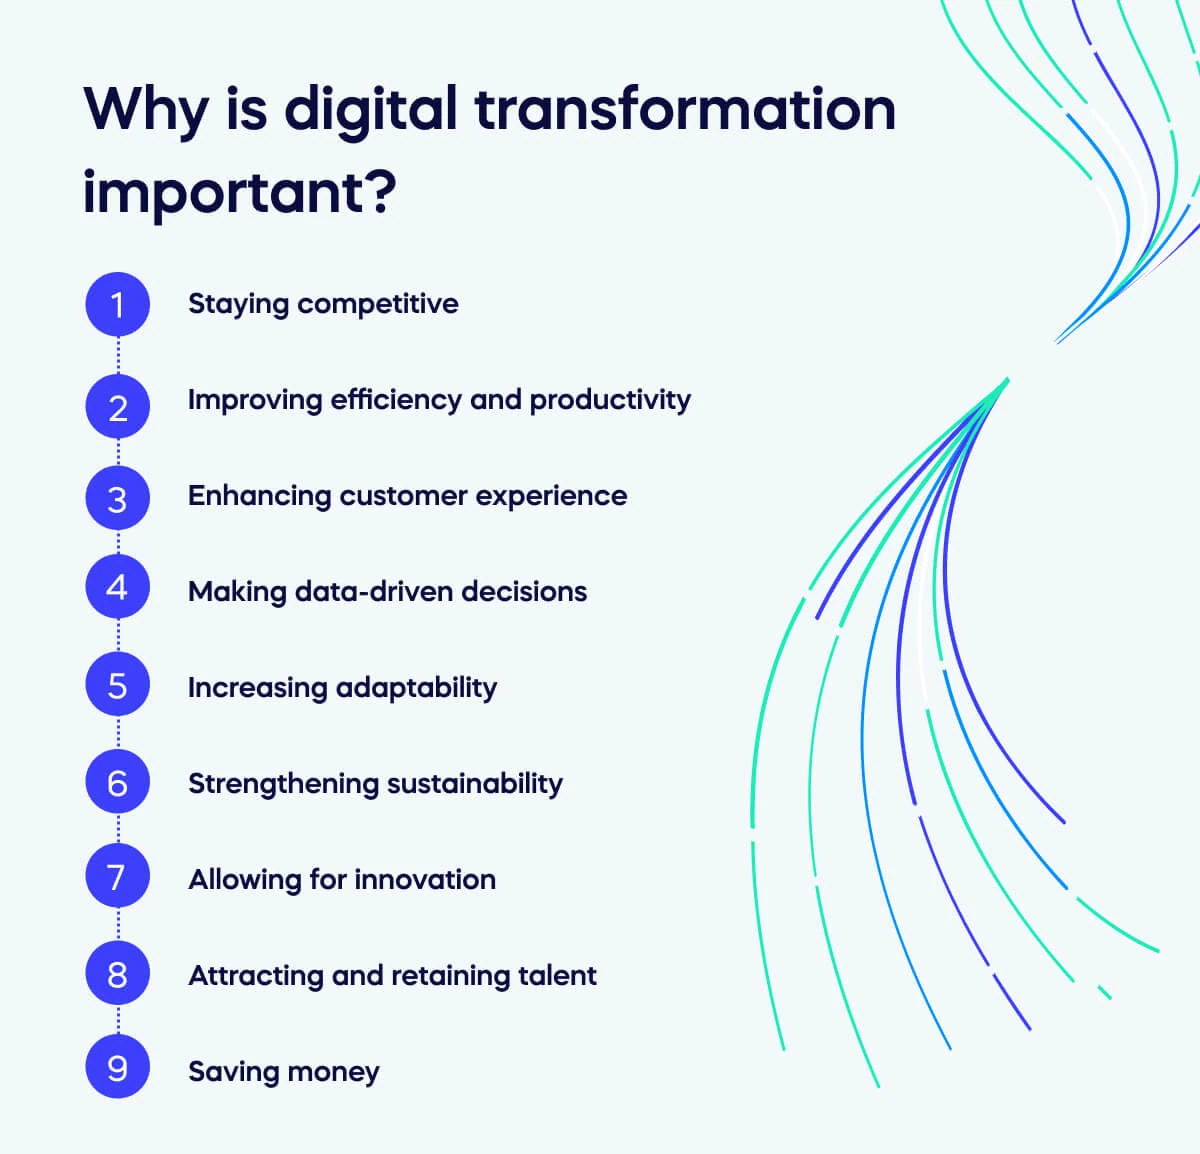
Digital transformation is crucial for businesses to stay competitive by enhancing efficiency and effectiveness. It streamlines processes, automates tasks, and improves data management, freeing employees to focus on more critical areas, thus boosting productivity.
Additionally, digital transformation enhances customer experience by enabling online services, personalized interactions, quick responses, and seamless experiences.
Organizations can collect and analyze vast amounts of data, making informed, data-driven decisions to meet customer needs better. This adaptability allows companies to keep pace with changing market conditions and customer demands, ensuring a responsive and flexible approach.
Digital transformation also strengthens sustainability by reducing energy consumption and paper waste, supporting environmentally friendly business practices. It encourages innovation, allowing companies to explore new business models, develop new products or services, and enter new markets.
Furthermore, a technologically advanced environment attracts and retains top talent, especially among younger generations entering the workforce. Companies with strong digital transformation strategies are more appealing to potential employees.
Finally, digital processes reduce the need for physical resources, manual labor, and paperwork, leading to significant cost savings over time.
How does digital transformation work?
No two businesses are identical, so digital transformation processes are not one-size-fits-all. A company’s approach depends on its needs, goals, and structure.
Here are some ways such a change can occur within specific organizations.
- A government agency may digitize its records and implement an online platform to streamline citizen services such as paying taxes or renewing licenses.
- An educational company may shift traditional classroom learning to online platforms, increasing their audience reach and providing flexible learning opportunities.
- A furniture store may create virtual showrooms with 360-degree views of products or online design tools to help customers visualize and plan their interior spaces.
- A glasses company may allow customers to try on their products by letting them upload a photo of themselves to the website.
- An e-commerce store may use AI algorithms to analyze customer behavior and preferences, offering personalized recommendations based on previous purchases and browsing history.
Types of digital transformation
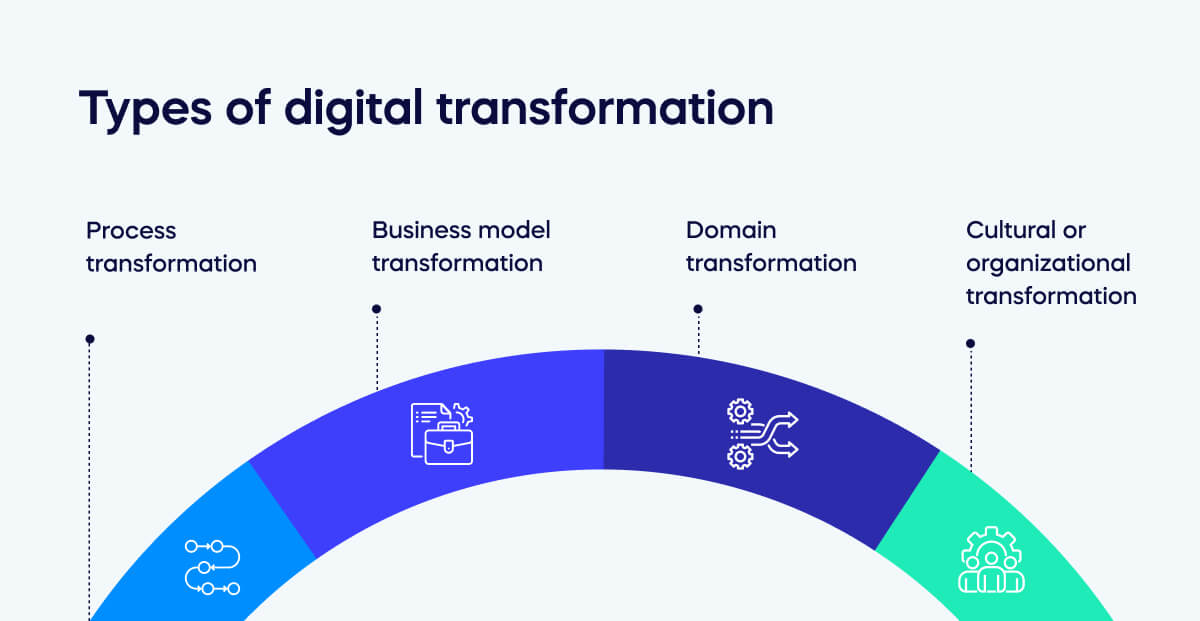
There are multiple types of digital transformation, including:
Process transformation
A significant change or advancement is made to the implementation, flow, design, or activities involved in a particular process. This type of digital transformation focuses on achieving specific goals, such as improved efficiency through technological improvement.
Process transformation may be triggered by changes in internal or external environments or a lack of effectiveness with the current processes. It aims to support company goals and use technology to reduce costs.
Business model transformation
A broader approach comprises changes in how a product or service is marketed. Instead of focusing on making incremental improvements or incorporating new technology, this type of digital transformation involves radically rethinking and restructuring the entire business model.
Business model transformation can become necessary due to changing market conditions, disruptive technologies, shifting customer preferences, or other external factors impacting the company’s long-term viability. The goal is to ensure an organization remains relevant and successful.
Domain transformation
This type of transformation is not as widely discussed, but it can be hugely successful. Domain transformation is when a business wants to enter a new market and diversify its portfolio.
New competitors or technologies may make it difficult to continue with or rely on the current business plan, so domain transformation helps to keep a company active and successful.
Cultural or organizational transformation
When cultural or organizational transformation is underway, management focuses on the people who power the company. A shift occurs in terms of either the behaviors and attitudes of employees to assist with achieving key goals or a restructuring of the organization to promote transparency, inclusivity, community, and collaboration.
Cultural or organizational transformation generally enables employees to become more open to digital adoption, as they will recognize the benefit of working for a digital-first business.
Digital transformation by industry type
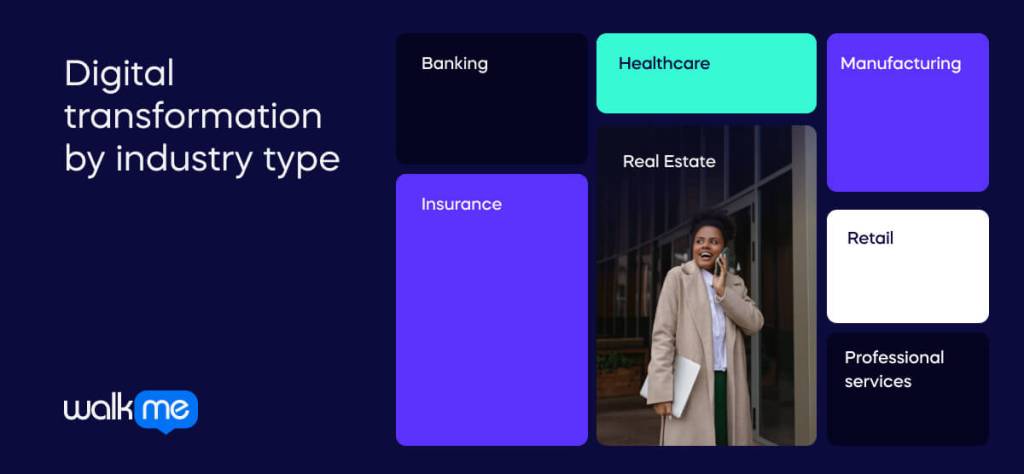
Implementing digital business transformation can differ by industry. Here are some significant industries’ approaches to digital transformation.
Banking
Digital transformation in banking can occur with omnichannel banking, personalization, data-driven decision-making, and collaboration with FinTech. However, the change has been slower than in other industries due to security concerns and the deep integration of systems.
Healthcare
Digital transformation in healthcare has resulted in considerable changes in the sector. AI and VR-based technologies have improved the customer experience and processes within organizations. Healthcare services are becoming more personalized as digital health data becomes increasingly available.
Retail
Digital transformation in retail is reshaping how we shop and interact with brands. Imagine personalized recommendations based on your preferences, seamless online and in-store experiences, and faster, more innovative supply chains. AI, IoT, and data analytics are behind these changes, making shopping more enjoyable and efficient for everyone.
Professional services
Digital transformation in professional services is seen in consultancies, tax companies, auditing organizations, and financial advice providers. These businesses benefit from edge computing, quantum computing, smart contracts, virtual presences, and blockchain.
Insurance
Digital transformation in insurance is relatively new. Organizations use data analytics to better sense customer needs and identify growth opportunities. The industry is under pressure to digitize to remain competitive in the sector.
Real Estate
Digital transformation in real estate is becoming more efficient and transparent, with AI helping manage properties, virtual reality offering immersive tours, and blockchain-securing transactions. These technologies make it easier for clients to find their perfect home and for agents to provide exceptional service.
Manufacturing
Digital transformation in manufacturing is transforming how products are made and delivered. Picture smart factories with interconnected machines, real-time data monitoring, and predictive maintenance. Technologies like AI, IoT, and robotics are driving efficiency and innovation, leading to higher-quality products and faster production times, making manufacturing more agile and responsive.
Digital transformation examples
Businesses must reimagine operations to thrive in the digital era.
There are many digital transformation examples to analyse. Below, we’ve focused on DHL, Adobe, and Cargill.
Three projects that show that with the right approach, any company can revolutionize their processes and achieve digital excellence.
Let’s explore:
DHL: Delivering data excellence
DHL’s digital transformation has driven greater efficiencies and higher productivity, as evidenced by the success of its Advanced Quality Control Center (AQCC).
This AI-powered system monitors real-time shipment movements, identifying and addressing issues swiftly. Such advancements have transformed previously laborious tasks into streamlined operations.
Historically a traditional industry, logistics has evolved significantly with the adoption of cutting-edge technology. DHL’s Strategy for 2025 aims to deliver excellence in a digital world, supported by an investment of over €2 billion from 2021 to 2025. These investments enhance customer and employee experiences and boost operational excellence across DHL’s 3,200 facilities in over 220 countries.
Ken Lee, CEO of DHL Express Asia Pacific, emphasizes, “By constantly listening to our customers’ needs, we have implemented technological innovations that are relevant and sensible for our customers, employees, and operations.”
Adobe Creative Cloud: Pioneering digital transformation
Adobe has revolutionized how we work and create, with products like Adobe Photoshop and Adobe Acrobat leading the charge.
This continuous transformation has driven Adobe to expand its focus on both business-to-consumer and business-to-business markets, resulting in a fourfold increase in revenue over the past decade. This remarkable growth is attributed to innovative product development, a strategic acquisition approach, and a comprehensive digital transformation journey.
Adobe’s transformation has enabled it to future-proof its business, expand capabilities, and open new revenue streams. Anil Chakravarthy, President of Digital Experience Business, highlights the potential of integrating innovations in AI, the metaverse, and enterprise technologies to serve all customer segments.
“We believe we’ll be able to take all of the innovation that you currently see, whether it’s in the world of artificial intelligence or in the metaverse or in enterprise technologies, and put that together to serve all the audiences in every customer segment,” says Chakravarthy.
Adobe’s internal transformation has been critical to this shift, using its products to streamline workflows and improve efficiency.
Cargill: Cultivating digital growth
For 158 years, Cargill has been a cornerstone of the global food, agriculture, financial, and industrial sectors.
Cargill’s embrace of digital and data strategies has been crucial as the largest privately held company in the US, with 155,000 employees across 70 countries and an estimated $165 billion in annual revenue.
Chief Data and Information Officer Jennifer Hartsock leads this transformative effort, navigating Cargill’s complex IT landscape to promote a unified approach under the company’s ‘better together’ ethos. “Solving real-world problems with technology and driving transformative change is at the heart of our digital journey,” Hartsock asserts, capturing the essence of Cargill’s innovative spirit.
Hartsock’s strategy emphasizes the integration of digital products and services, enhancing customer experiences, driving efficiency in Cargill’s intricate supply chain, and improving the digital experience. Initiatives like Powered by Plant aim to empower Cargill’s 100,000 frontline workers by providing them with superior digital tools and experiences.
Key drivers for digital transformation
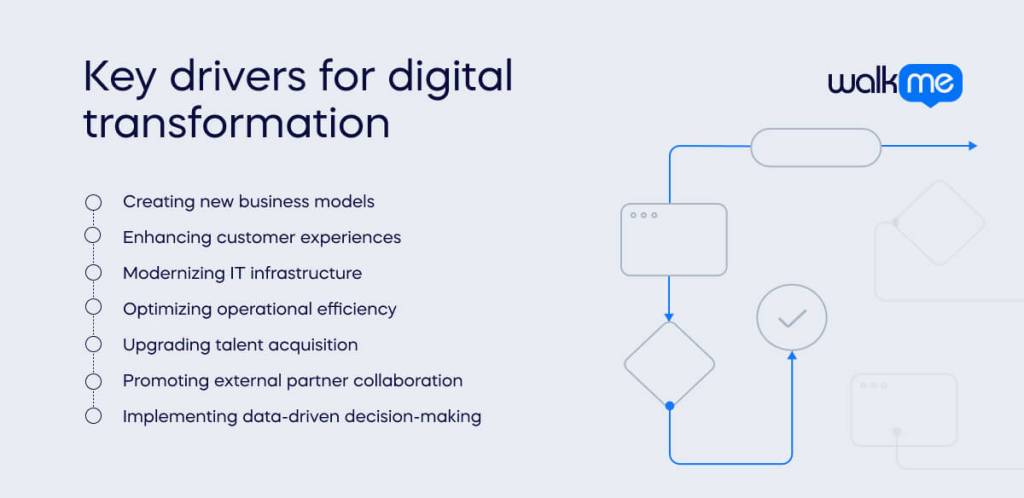
Businesses implement digital transformation for several key reasons, each tailored to their needs. Here are the key drivers for digital transformation:
- Implementing data-driven decision-making: Accessible data allows for accurate and swift decision-making, helping businesses anticipate trends and measure success effectively.
- Creating new business models: Staying competitive requires innovative digital models. Companies are adopting freemium, on-demand, and subscription models to offer new products and services.
- Enhancing customer experiences: Leveraging AI for personalized recommendations and security management enhances the customer experience, meeting the high expectations of modern consumers.
- Modernizing IT infrastructure: Updating legacy systems with IoT, cloud-native applications, and business intelligence (BI) tools helps businesses grow and scale efficiently.
- Optimizing operational efficiency: Digitizing operations with APIs and automated systems reduces manual steps and human error, improving overall efficiency.
- Upgrading talent acquisition: Training current employees and attracting new talent with updated skills ensures the workforce can support digital initiatives.
- Promoting external partner collaboration: Digital processes facilitate better integration with stakeholders, leading to new business models and improved services.
Digital transformation enablers & barriers
Digital transformation reshapes industries by leveraging advanced technologies to enhance efficiency, innovation, and customer experience. Understanding the digital transformation enablers and barriers is crucial for organizations to navigate this complex and dynamic journey successfully.
Enablers
Digital transformation is about leveraging the right technologies and strategies to unlock a business’s full potential, boost competitive advantage, and improve operational efficiency.
The most impactful enablers continue to be:
- Employees
- Business solutions
- Digital adoption platforms (DAPs)
- Cybersecurity, cloud computing
- A data-centric approach
- Robotic process automation (RPA)
- Artificial intelligence/machine learning (AI/ML)
- Internet of Things (IoT)
- Augmented reality (AR)
These tools and approaches help streamline workflows, respond quickly to customer demands, and drive long-term growth.
Looking ahead, future enablers might include adaptive AI, which improves learning speed and accuracy, digital twins that offer real-time virtual representations for better decision-making, and sustainable technologies that cut costs, reduce environmental impact, and encourage innovation.
Barriers
Digital transformation barriers can prove challenges.
One of the biggest challenges is getting everyone on board. Employees might be used to their current working methods and resist change. To overcome this, involving them in the process is important, making them feel part of the journey rather than overwhelmed.
Another significant barrier is poor communication. Just announcing new initiatives isn’t enough. Leaders must actively explain why changes are happening, share demos, give employees early access, and ask for feedback. This keeps everyone in the loop and maintains enthusiasm.
Lack of measurement can also stall progress. Clear goals are necessary to stay on track, and KPIs must be adjusted. Everyone should understand the purpose and expected benefits of the transformation.
Additional barriers include outdated technology and limited budgets. Outdated systems can slow down implementation, requiring costly upgrades. Limited budgets can restrict the scope and pace of transformation, making it essential to prioritize key areas and seek cost-effective solutions.
Digital transformation metrics and measurements
Executing a digital transformation initiative is significant, even for experienced CIOs. Beyond implementation, creating meaningful KPIs is crucial but often overlooked. Many companies get caught up in launching their initiatives, neglecting the importance of measuring digital transformation progress, which can cripple their efforts.
Our State of Digital Adoption report found that 59% of enterprises failed to meet their digital project KPIs, indicating significant challenges in managing digital transformation costs. This highlights the need for a robust system to monitor progress and identify weak points.
Effective KPIs for digital transformation include:
- User Adoption: Compare licenses purchased to actual usage.
- Usability Analysis: Understand how digital tools are used.
- Process Metrics: Track processes performed on new software.
- Productivity Indicators: Measure outputs relative to inputs.
- Revenue Impact: Link digital investments to new revenue.
Choosing the right measurement software is also vital. It should be easy to use, integrate with existing systems, and provide detailed insights to guide your transformation effectively.
Digital transformation frameworks
Deploying a structured response to the ever-changing business world is challenging, but a digital transformation framework can make it manageable.
Our State of Digital Adoption Report shows that 67% of organizations feel pressured to speed up digital transformation, making a well-structured framework essential.
A digital transformation framework guides organizations through significant changes using digital technologies. It helps identify issues, develop strategies, and implement changes, focusing on customer value and market position over just technology.
The benefits are substantial. It aligns everyone with common goals, improves communication, and boosts operational efficiency. Leaders get a clear roadmap, employees understand their roles, and operations align with strategic goals. Financially, it helps map current and future states, while technology assessments ensure digital resilience.
To choose the best framework, start by exploring your vision, recording the details, implementing it with clear communication, and reviewing it regularly. Using a Digital Adoption Platform (DAP) can support your employees through these changes, ensuring a smooth and successful transformation journey.
Digital transformation roles & responsibilities
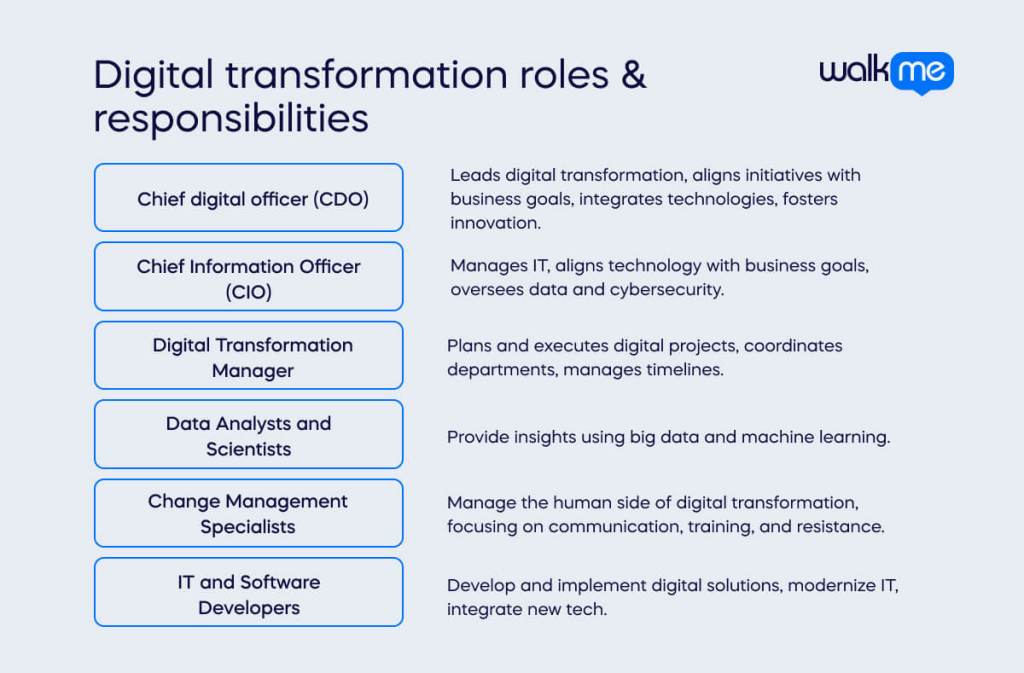
Digital transformation involves various roles and responsibilities to ensure its successful implementation. Here are some key roles and their responsibilities:
- IT and software developers: They develop and implement digital solutions, from software applications to cloud services. Their work is crucial in modernizing IT infrastructure and integrating new technologies.
- Chief digital officer (CDO): The CDO leads the digital transformation strategy, aligning digital initiatives with business goals. They oversee the integration of digital technologies and foster a culture of innovation within the organization.
- Chief information officer (CIO): The CIO manages the IT infrastructure, ensuring it supports the digital transformation efforts. They collaborate with other executives to align technology with business objectives and oversee data management and cybersecurity.
- Digital transformation manager: This role focuses on planning and executing digital projects. They coordinate between different departments, manage project timelines, and ensure the projects meet their objectives.
- Data analysts and scientists: These professionals analyze data to provide insights that drive decision-making. They use big data, predictive analytics, and machine learning to improve operations and customer experiences.
- Change management specialists: They manage the human aspect of digital transformation. Their role is to prepare, support, and help individuals and teams in making the change. They focus on communication, training, and addressing resistance to change.
Key steps to enabling digital transformation
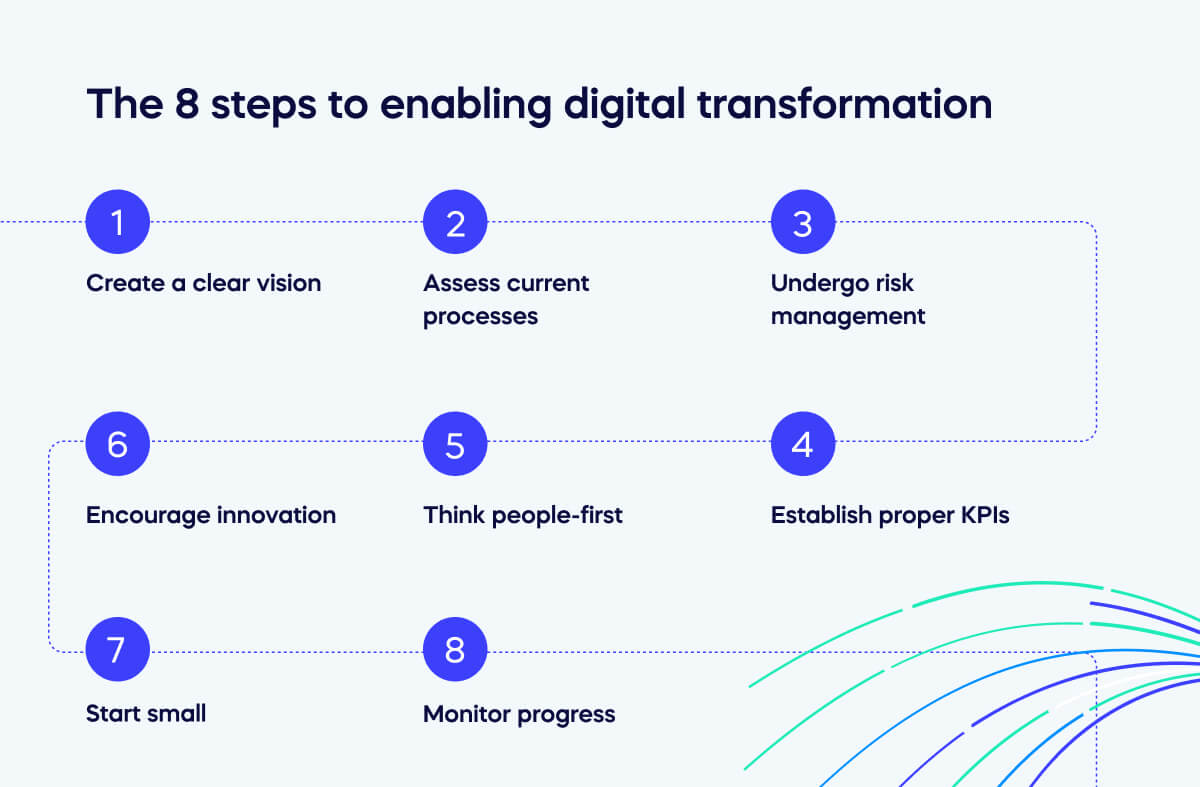
Follow these steps if you want your digital transformation strategy to succeed:
Create a clear vision
Set out a clear definition of why you want to undergo a digital transformation process. For example, you may want to streamline operations, improve customer experience, or enter new markets. Whatever your goals are, ensure there is a clear vision for where the business is going.
Undergo risk management
Identify potential risks and challenges, including security vulnerabilities, data privacy concerns, or employee resistance. Take the time to develop mitigation strategies to address these points of possible friction.
Think people-first
Consider how the digital transformation process will impact customers and employees. Ensure that customers are kept at the epicenter of any transformation in response to drastic changes in the market. Develop processes that ensure customer satisfaction is front and center. Keep all stakeholders informed about the progress and benefits of digital transformation. Address concerns, gather feedback, and keep them involved in the process to mitigate resistance.
Start small
Test out new processes by launching small pilot projects to test new business operations. Keeping the projects manageable will make it easier to identify challenges and refine your approach so that roadblocks can be tackled. Once the pilot succeeds, successful initiatives can be scaled up across the organization.
Assess current processes
Carry out a comprehensive assessment of current business processes, technologies, and organizational culture to identify any pain points, bottlenecks, and opportunities for improvement.
Establish proper KPIs
Define measurable KPIs which will help you to track the success of your digital transformation efforts. For example, you may develop cost savings, revenue growth, or customer engagement metrics. Ensure reporting systems are set up ahead of time so that the process can be kept on track.
Encourage innovation
To successfully achieve digital transformation, being agile is essential. It begins by creating a business environment that fosters experimentation and encourages innovative thinking to take root and thrive. Encourage teams to work across departments so that new business processes become holistic and everyone understands how others contribute to business operations.
Monitor progress
Constantly check and monitor the progress of your digital transformation program against objectives to ensure it is on track. Analyze outcomes and adjust strategies that aren’t performing as expected to keep the process on track.