Data alone isn’t beneficial unless it’s straightforward to understand. Digital tools that help turn raw data into simple visuals can make complex information easier to grasp. These visuals can also highlight important patterns and trends that might go unnoticed.
Salesforce matrix reports, an example of this type of tool, are powerful because they let strategic leaders analyze data by both rows and columns. This helps reveal business performance across teams, regions, and periods. Salesforce automation software like this is also handy for tracking digital adoption, data quality, and process compliance during Salesforce rollouts.
This guide will show you how to build matrix reports, explore their features, and use best practices to keep your project on track.
What is a Salesforce matrix report?
A Salesforce matrix report is a reporting feature that displays data in a grid, allowing users to compare two elements simultaneously, such as rows and columns. It helps spot trends and summarize results. For example, you can look at sales by region and product.
Visual elements, such as color-coded cells, charts, and graphs, help highlight key trends and outliers. With just a glance, decision-makers can spot patterns in sales, customer satisfaction, or team performance.
Customizing the layout is straightforward, allowing users to group data by product, region, or time. Filters can narrow the focus to the most relevant information. By automatically summarizing data, matrix reports save time and improve the employee experience.
When tracking performance across teams or time, matrix reports provide a valuable overview. Users can tailor the report by adding summary formulas and selecting the display format for the results. As a result, insights become easier to share across teams.
What are the features of a Salesforce matrix report?
Being aware of the features of a Salesforce matrix report enables you to view data from multiple perspectives. It provides a clear view of how different data points connect and reduces data silos. This helps you identify trends and make more informed decisions.
Matrix reports group data by rows and columns, making them ideal for comparing totals and analyzing detailed information.
Here are the various features of a Salesforce matrix report you could take advantage of:
Multi-dimensional grouping
In Salesforce matrix reports, multidimensional grouping allows you to organize data by both rows and columns. This grid layout helps you compare information across different categories, making it easier to spot patterns.
For example, you can group opportunities by sales stage in the rows and by product in the columns to see how each product performs at each stage of the sales cycle.
Automatic aggregations
Automatic aggregations, a feature of Salesforce matrix reports, enable the system to calculate totals, averages, or counts for your grouped data. This makes it easier to compare results across teams, periods, or product categories.
You can quickly spot trends or issues without doing manual calculations. For instance, you can track sales by region and product, or measure case resolution times by team and priority.
Conditional formatting and drill-downs
Conditional formatting in a Salesforce matrix report helps highlight important data using colors or styles based on rules you set. You can instruct the report to highlight cells when it encounters specific values or ranges. In addition to conditional formatting, employees can also utilize drill-down features to explore the data in greater detail.
For example, you can mark high sales numbers in green or low ones in red, or highlight big deals or top-selling regions. It helps you quickly identify what matters most, focus on key numbers, and make faster, more informed decisions.
How to create a Salesforce matrix report

When you understand how to create a Salesforce matrix report, you can study relevant data in more detail. Matrix reports group data in two ways, so you can find patterns more easily than with other reports.
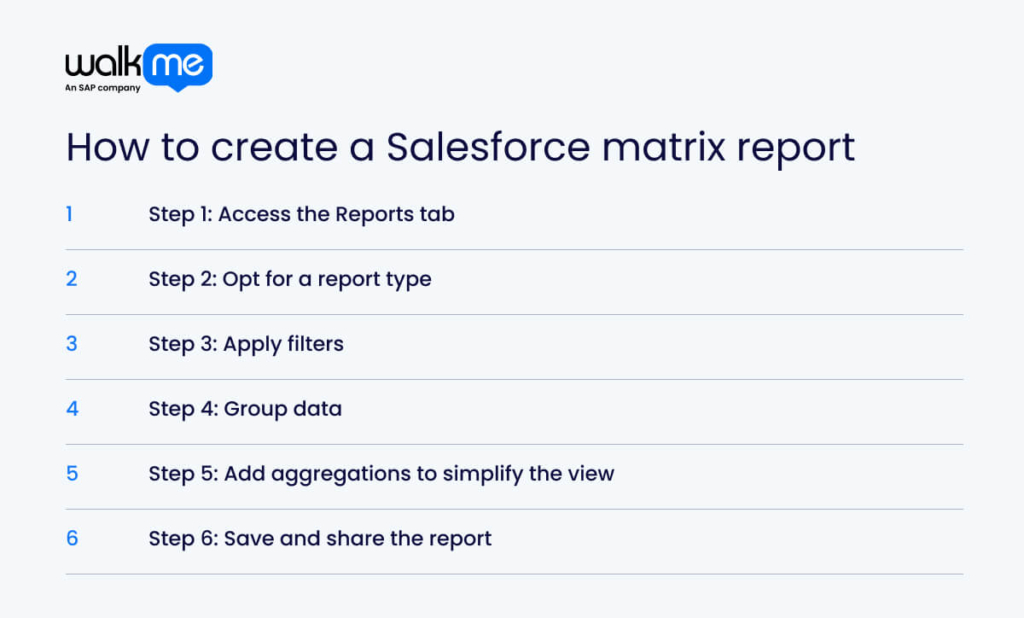
Let’s go through the steps you can take to build your Salesforce matrix report:
Step 1: Access the Reports tab
To begin this process, click the App Launcher (represented by nine dots) and select Sales. Then, click the Reports tab. To start creating a report, click New Report to open the Report Builder.
Step 2: Opt for a report type
Select the appropriate report type based on the data you want to analyze, such as Accounts or Opportunities. In this instance, select Matrix as the report format when choosing the report type.
Step 3: Apply filters
Use the Report Builder to change the report. Add filters to focus on the data you want, such as dates, owners, or specific values. In this way, you can pick the fields you want to show in the report.
Step 4: Group data
You can group your data by rows and columns. In the report builder, select the fields to group by and choose whether they should be displayed in rows or columns. For rows, you might group by Stage to see opportunities by sales stage.
In terms of columns, you can choose a field like Fiscal Quarter or Region, especially if looking at Salesforce forecasting. You can add more groups to display details and adjust the appearance of totals and subtotals in the report.
Step 5: Add aggregations to simplify the view
Aggregation groups detailed data into simpler summaries, making large datasets easier to understand. In Salesforce, you group by fields and apply functions like sum or average. This helps avoid needing to count twice and creates clear, summary reports based on the chosen groupings.
Step 6: Save and share the report
After building your report, click Save. Give your report a clear name and short description. Select a folder to store it—this determines who can view it. To share the report, navigate to the folder, click the dropdown menu, and select Share.
Choose users, roles, or groups, and set their access level (View, Edit, or Manage). You can also share the report by sending a public link or emailing it to specific people.
Use cases for a Salesforce matrix report

Knowing when to use Salesforce matrix reports is crucial because they enable you to analyze and compare data in greater detail.
They reveal insights that summary reports might miss. You can use matrix reports to summarize large amounts of data or check values across different fields.
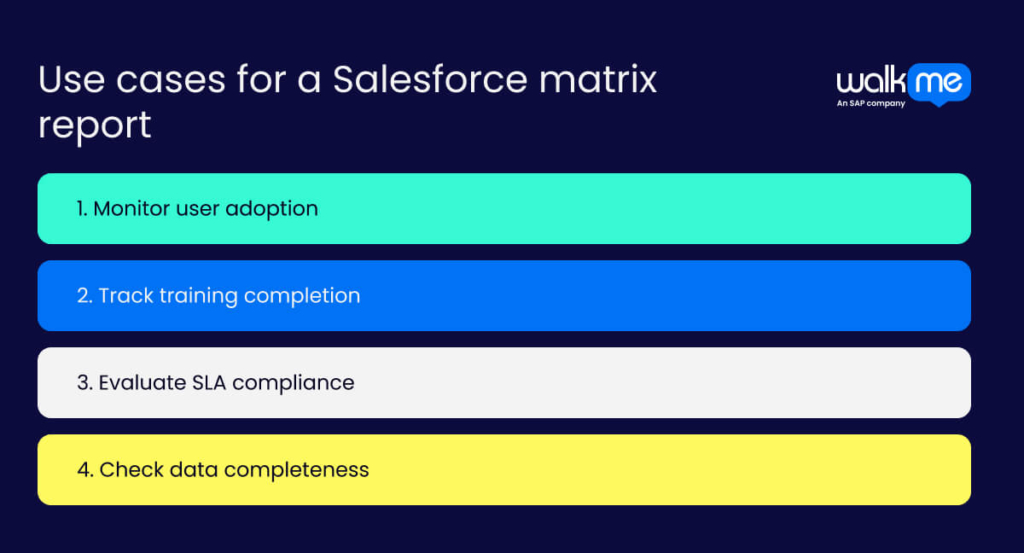
These are some ways that a Salesforce matrix report could be helpful in your business:
Monitor user adoption
A Salesforce matrix report helps you track how users adopt a system. This makes it easier to find patterns and spots where adoption is low. Effective user adoption leads to improved data, a higher return on investment, and ultimately, happier users.
To initiate the tracking process, select Salesforce adoption metrics such as login frequency, record updates, and feature usage. Then, set up the report with users as rows and activities as columns. Use what you learn to offer training or support. Check the report regularly to monitor the adoption progress and adjust your plan as needed.
Track training completion
Matrix reports provide a clear view of training progress by showing who is completing which courses and how far they’ve progressed. For instance, you can easily identify e-learning gaps by seeing who hasn’t completed required courses or is falling behind.
Tracking this also helps with compliance and employee onboarding. Begin building your report by selecting the appropriate objects, such as Users and Courses. Group data by rows and columns, add filters, and summarize key information, such as completion counts, before saving.
Evaluate SLA compliance
Meeting Service Level Agreements (SLAs) is crucial in improving customer retention and lowering costs. You can use a Salesforce matrix report to check SLA compliance by comparing service performance to agreed-upon goals.
First, define key KPIs, such as response or resolution time. Then, create a matrix report to show this data. Analyze the report to identify trends and issues, and use the findings to inform improvements.
Check data completeness
Incomplete data can lead to poor decisions, inefficient customer service, and lower employee productivity. It also compromises the quality of your Salesforce database, leading to errors and inconsistencies.
To check data completeness, create a matrix report that groups records by key fields. Use filters to identify missing information and review the results. Resolve issues by adding rules, making fields required, or rolling out employee training.
Best practices for Salesforce matrix report implementation
Using best practices for matrix reports in Salesforce helps you create clear, simple, and valuable reports.
As matrix reports show more detailed data than other types, you must plan carefully. You can do this to avoid slowing down the system or making the report too complex.
Opt for best practices like these that you can use to improve the matrix report’s usability:
Keep reports outcome-driven
Salesforce matrix reports enable you to compare data across multiple factors, making it easier to identify trends and patterns. Start by setting a clear goal, like enhancing sales or reducing churn. Choose the right level of detail—by product, region, or time.
Use filters to focus only on what will improve the user experience. Group data by rows and columns to view it from different angles and add color highlights to key results. This approach gives decision-makers insights they can act on with confidence.
Limit complexity
Keeping matrix reports simple makes it easier for users to understand the data and spot key patterns. Start by setting a row limit in the report builder to focus on essential records. Use filters to narrow down the data based on fields like stage or type.
Summarize by rows or columns to make the report easier to read. For more detailed views, use the matrix report as a source for dashboard charts or tables without adding extra complexity.
Standardize structure
Standardizing Salesforce reports helps users understand and compare data more easily. First, consider the same row and column groupings, such as territory and product type, across all reports. Apply summary types such as sum or average, and use clear visuals to highlight key data.
Create a data dictionary to define the meanings and formats of fields. Train users on the standard layout and organize reports in folders. Remember to review reports regularly to ensure they remain accurate, consistent, and valuable across your organization.
Leverage cloning and templates
Cloning and templates make it easy to create and manage matrix reports in Salesforce. Cloning enables you to duplicate an existing report, modify it as necessary, and retain the original intact. This type of report is particularly well-suited for different audiences or testing filters.
Templates provide a consistent layout for reuse, saving time and ensuring uniformity in reports. Simply create a report, save it as a template, and customize it as needed. Both options help ensure transparent and consistent reporting without requiring a restart from scratch each time.
Salesforce matrix reports: Your solution for post-implementation governance
By embedding matrix reports into your governance and monitoring processes, IT leaders can proactively identify technology adoption gaps, improve data quality, and align business units. As a result, it can turn raw data into strategic insights that drive lasting Salesforce success.
Successfully implementing Salesforce matrix reports requires a clear focus on business goals and a disciplined approach to report design. Start by defining the key questions your implementation team needs to answer.
Then build reports that deliver actionable insights through effective grouping, filtering, and aggregation. Consistency in naming, folder organization, and report templates ensures scalability and easier maintenance across teams.
FAQs
In Salesforce, a matrix report differs from a summary report in that it groups data by both rows and columns. This gives you a two-dimensional view of your data. A summary report only groups data by rows, showing a one-dimensional view.
Salesforce has four main report types: tabular, summary, matrix, and joined. Each type allows you to organize and display your data in various ways. They help you group, summarize, and analyze your data based on your specific needs.

