Using real-time data helps you improve business adaptability and its overall return on investment (ROI).
But raw numbers in a table or spreadsheet can confuse even experienced users. Our brains find it easier to understand patterns through visuals like charts and graphs. Data visualization makes it easier to spot trends and insights that guide action.
Salesforce reports enable cross-functional teams to turn complex data into visuals that support more informed decisions. With clear reports, teams can see the bottom line, share key metrics, and plan investments more effectively.
In this guide, we’ll explore what Salesforce reports are and their various types. You’ll also learn to create, manage, and customize reports, including advanced and recurring options.
What are Salesforce reports?
Salesforce reports are a visual representation of a company’s performance in various areas.
This type of view helps them track progress and make informed decisions. Users build reports to monitor revenue, sales pipelines, and deal status. These reports highlight trends, reveal gaps, and support changes in sales strategies. By using reports, teams can avoid manual tracking and focus more on achieving their business goals.
Teams can also use reports to share updates and stay aligned with one another. Additionally, sales representatives can track their personal goals and identify areas for improvement. Reports also support Salesforce forecasting by predicting future results based on real-time data.
Furthermore, reports can be beneficial in various business areas. Users can track sales quotas, monitor product performance, and analyze customer behavior to optimize their sales strategies. They can also evaluate marketing campaigns, lead conversions, and account growth. Lastly, Salesforce reports can improve opportunity tracking by flagging risks or delays.
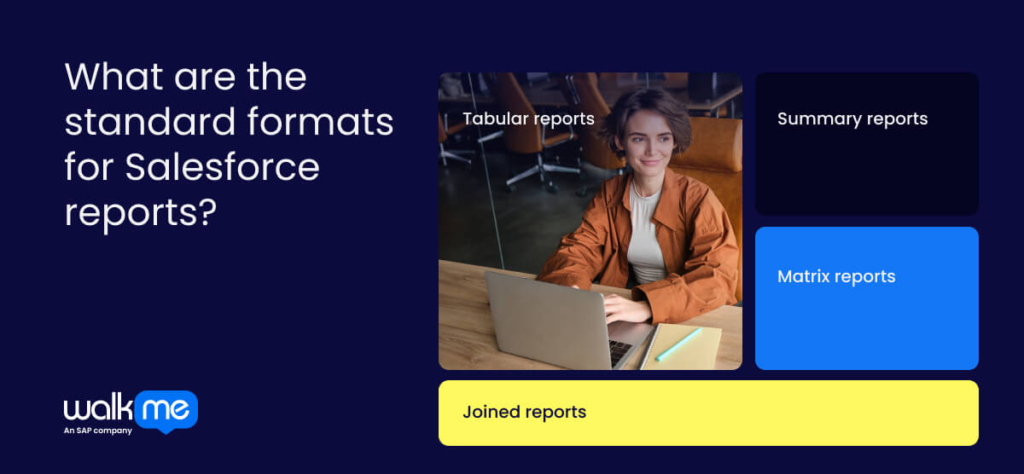
What are the standard formats for Salesforce reports?

When you are familiar with the four report types—tabular, summary, matrix, and joined—you can select the most suitable one for your needs.
This helps you share data clearly and build dashboards that display different views of the same information.
These are the ones you need to be aware of:
Tabular reports
A tabular Salesforce report displays data in a simple list format, with fields as columns and records as rows. It lets you quickly access and update data. Use tabular reports for Salesforce tasks, such as creating mailing lists, finding records for outreach, and exporting data. However, as they are simple reports, they lack group and chart features.
Summary reports
A summary report groups data into category rows and shows subtotals for each group. It allows you to add summary formulas for calculations and create charts or graphs for improved visualization. You can group data by one or more fields to create hierarchical structures. This type of element makes it versatile for various forms of analysis.
Matrix reports
A matrix report in Salesforce groups data by both rows and columns (unlike a summary report). In this way, it helps compare totals, analyze trends, and measure behavior across groups. Matrix reports also allow customization, making them helpful in summarizing complex data.
Joined reports
A joined Salesforce report combines data from multiple report types into a single view. You can group and summarize data across objects to identify trends and patterns. Customize each block with filters, groups, and formulas to improve analysis. This feature saves your business time and effort by merging multiple reports.
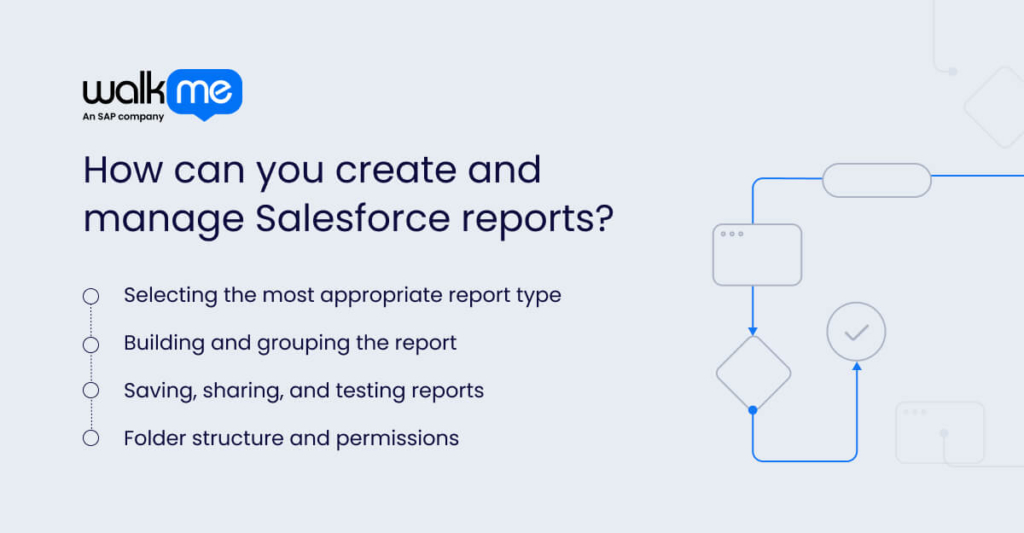
How can you create and manage Salesforce reports?

Understanding how to create and manage Salesforce reports allows you to track performance.
Furthermore, it helps you spot trends, customize views, share insights, and save time by automatically pulling data.
Here are the most essential creation and management features you need to grasp:
Selecting the most appropriate report type
To select the appropriate Salesforce report type, first determine the data you require. Consider the relationships between objects. Consider the report’s purpose and how it aligns with your needs. Tabular reports are used for simple lists, while summary and matrix reports are suitable for analyzing data.
Adopt joined reports to combine data from multiple sources. If standard reports don’t meet your needs, create custom report types. Salesforce also offers a report type selector. This tool helps you find the right report for your requirements.
Building and grouping the report
To build and group a Salesforce report, select a report type in the Lightning Report Builder. Use the Filters pane to narrow down the data by specific criteria, such as date or owner. Add fields by dragging them from the Outline pane into the preview.
Group data by dragging a field to a drop zone or selecting ‘Group by this Field’ in the column menu. Save the report with a name and description, then click ‘Run’ to view the results. Share or add the report to a dashboard.
Saving, sharing, and testing reports
Begin by saving the Salesforce report in a folder. Share the folder with the appropriate users or groups. Run the report to check its accuracy and ensure it displays the correct information. This process helps verify that the report is correct and accessible to those who need it.
Folder structure and permissions
To create report folders and manage permissions in Salesforce, go to the ‘Reports’ tab and select ‘All Folders.’ Create a folder, click the action menu, and choose ‘Share.’
Select users or groups and set access levels: Viewer, Editor, or Manager. Click ‘Done’ to save settings. Enhanced Folder Sharing (EFS) provides better access control. This feature can be enabled by your Salesforce administrator for Lightning Experience.
What are custom Salesforce report types, and how can you use them?
Knowing how to use custom report types in Salesforce helps you build reports that fit your exact business needs. This is useful when standard reports don’t give you enough options.
Let’s dive into what they are and how you can maintain them:
What are custom report types?
Custom report types in Salesforce provide users with complete control over the data displayed in reports. You can select the main object, add related objects, and choose which fields to include. This setup enables you to create customized reports tailored to your specific needs.
Instead of standard reports, you define exactly what data to include and how to display it. You can combine data from different sources, show only relevant fields, and organize reports. Custom report types serve as templates, making it easier to create useful reports. With improved data access, users can save time, gain deeper insights, and make more informed decisions.
How to build and sustain CRTs
To build custom report types, define the purpose and target audience. Understand the report’s use and the users’ needs. Select the primary object (e.g., Accounts) and related objects (e.g., Contacts).
Choose the fields relevant to the report’s goal. Define relationships between objects and customize the layout for clarity. Add formula fields for calculations. Test the report type and make any necessary adjustments.
To maintain custom report types, review and update them on a regular basis. Gather feedback to improve user adoption. Limit fields to improve performance. Stay informed about best practices. Manage access permissions and monitor performance to resolve issues.
What advanced Salesforce reporting features can you adopt for your business?
When you master advanced Salesforce reporting, you unlock the full power of your data to make better business decisions.
These tools help you track complex metrics, analyze trends, and tailor reports to your needs. This improves performance and the customer journey.
Here are the advanced features you can take advantage of:
Row-level and summary formulas
Row-level formulas calculate data for individual records, providing insights without requiring data export or modification. Summary formulas aggregate data, enabling you to calculate totals, averages, percentages, and other key metrics for a comprehensive overview.
To create a row-level formula in Salesforce, open the Lightning Report Builder, edit the report, and click ‘Add Row-Level Formula.’ Name the formula, choose the output type, and enter the formula. Validate, apply, and save the report. For a summary formula, follow similar steps under ‘Add Summary Formula.’
Cross filters and field-to-field filters
In Salesforce, ‘Cross Filters’ let you analyze data across different objects. On the other hand, Field-to-Field Filters compare values within the same report. To create a ‘Cross Filter’, add a filter in the report builder, select a parent and child object. Then, filter ‘with’ or ‘without’ the child. For a ‘Field-to-Field Filter’, enable the feature and add the filter.
Historical trend reports and snapshots
Historical trend reports track changes in field values over time, enabling you to identify trends and patterns. Reporting snapshots save report data to a custom object for future analysis and reference.
First, enable Historical Trending for your objects. Then, create a custom report type and build a tabular or summary report. Lastly, map fields to a custom object and schedule the snapshot.
How can you set up recurring reports and updates?
When you set up recurring reports and updates, you save time and automatically track key data. Users gain real-time insights without additional effort, enhancing digital workflows.
So, you can automate reports through:
Scheduled reports
Being able to schedule reports keeps your team updated, tracks key data, and automatically shares insights. To schedule a report in Salesforce, open the report and click ‘Subscribe’. Set the options under the ‘Schedule’ tab. Choose how often to send it, select the time, pick the recipients, and set the email format.
Subscriptions and conditional alerts
In Salesforce, users can create report and dashboard subscriptions with alerts. These alerts notify them when data meets certain conditions or changes. This helps users track essential metrics, stay updated, and act quickly. By setting alerts, teams can make more informed decisions and respond more quickly to key business changes.
How can you embed reports within Salesforce dashboards?
Embedding reports in Salesforce dashboards enables you to view and understand data more clearly.
You get a full view of key numbers, spot trends easily, and share insights with others. This helps you track progress and make wise decisions.
Here’s what you need to account for when embedding reports:
Adding report components to dashboards
Adding report parts to Salesforce dashboards enables you to display key data visually. This makes it easier for users to understand the data and make quick decisions.
To add a report to a Salesforce dashboard, go to Dashboards. Create a new one or open an existing one. Click the ‘+’ button. Choose a chart, table, or gauge. Select your report. Drag it onto the dashboard. Click ‘Save and Done.’
Using dashboard filters for interactivity
To make dashboards more interactive, add filters in the editor by clicking ‘+ Filter.’ Select a field, such as ‘Opportunity Stage’, set the filter name, and choose the desired values. Add filter rules, save them, and then apply. Then, preview and test the dashboard by changing filter values to see updated data.
Build a lasting value with a Salesforce reports roadmap
Effective Salesforce reporting goes beyond showing data—it drives better team decisions. IT and implementation leaders must align reports with business goals, select the appropriate report types, and integrate reporting into the CRM rollout. Use standard dashboards and custom reports to provide users with clear, actionable insights.
As reporting needs grow, leaders should manage access, automate key reports, and provide training to users to help them understand the data. By focusing on governance and enablement, you ensure that reports stay relevant and strategic. Better reporting also allows your team to work with organizational agility and stay aligned on strategic values.
FAQs
Salesforce has four main types of reports: Tabular, Summary, Matrix, and Joined. Each type shows and organizes data differently.
In Salesforce, List Views quickly filter one object’s records. Reports are better suited for in-depth analysis and data from multiple sources or objects.
To keep reports organized in Salesforce, use folders based on teams or tasks. Give reports clear names and save them in the correct folders. You can also create custom report types for specific needs and specify who can view each report.

