Many companies use Salesforce to capture, store, and analyze customer data, driving business transformation. But every year, their strategic leadership team will also want proof of its value. They need to see clear returns on investment to support future upgrades and costs.
A Salesforce reporting tool can help demonstrate this by taking raw CRM data and transforming it into relevant insights. For instance, it can prove the effectiveness of the current sales process by extracting and analyzing sales metrics, such as deal size, cycle length, and conversion rates.
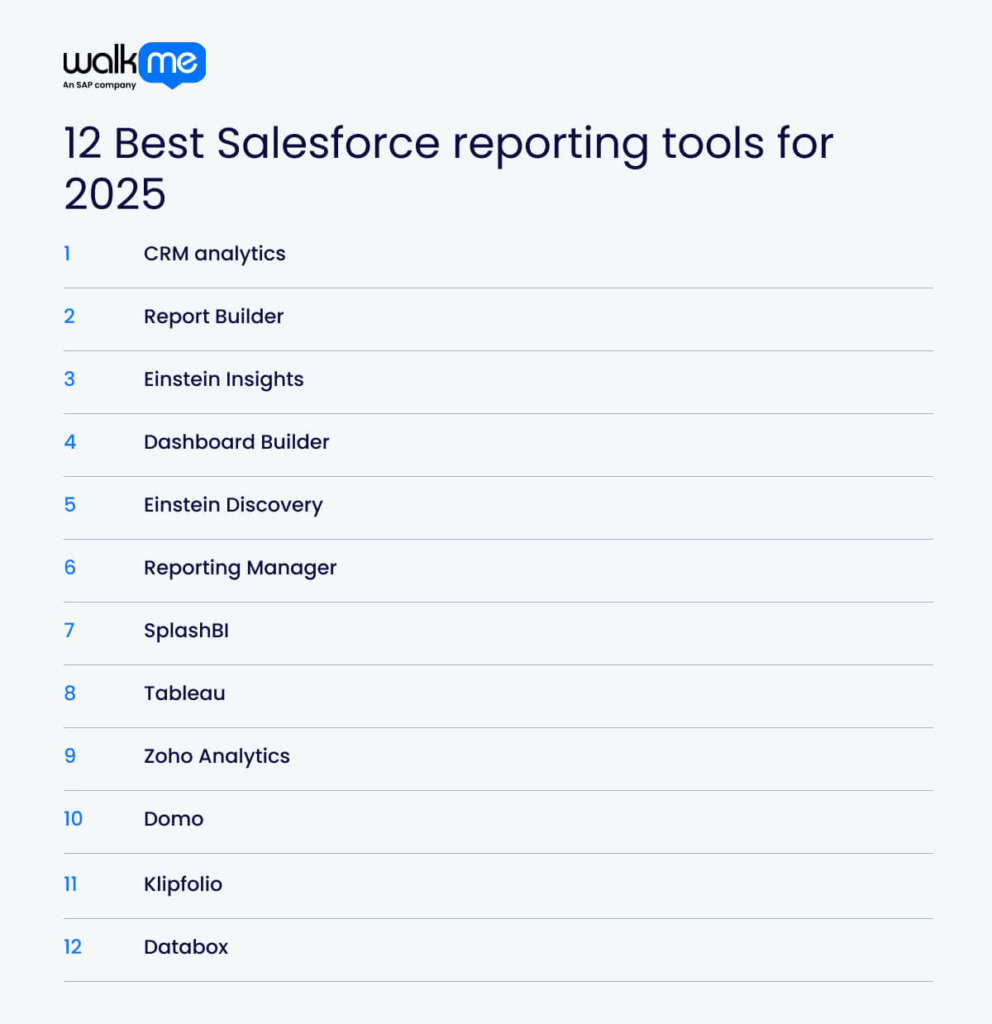
However, selecting the right Salesforce reporting tool for your specific requirements can be challenging. In this article, we explore native and third-party Salesforce reporting tools to help IT executives select tools that align with their systems and goals.

6 Top native Salesforce reporting tools
A native Salesforce reporting tool integrates directly with the Salesforce platform. They provide real-time data access and easy-to-use reports.
These tools enable teams to analyze data, track progress, and make informed decisions directly within Salesforce. Furthermore, they safeguard data and audit trails to ensure security and compliance.
Here are examples of a native Salesforce reporting tool you should adopt for your organization:
- CRM analytics
CRM Analytics in Salesforce provides users with AI-powered insights and predictions, enabling them to make more informed decisions. It uses Einstein Discovery and other AI tools to forecast outcomes and recommend next steps. Employees can create custom or use pre-built apps for Salesforce forecasting and customer segmentation. They clean, prepare, and transform data using recipes and dataflows.
Furthermore, CRM Analytics lets users work within Salesforce, such as assigning tasks or closing cases. They access insights on mobile devices and act on them at any time. The platform helps users strengthen customer relationships and grow their business by acting on data-driven insights.
- Report Builder
The Report Builder in Salesforce enables users to create and edit reports using a simple drag-and-drop interface. Users can choose from various report types, including tabular, summary, or matrix, to suit their specific goals. They group and filter data, summarize columns with totals or averages, and create custom report types to focus on particular objects.
You can also add or remove fields by dragging or double-clicking them. In addition, it’s possible to apply conditional highlighting to call out key data points. After building the report, team members can view and share it from the Report Run Page. To access these features, you must have the ‘Create and Customize Reports’ permission in Salesforce.
- Einstein Insights
Einstein Insights utilizes AI to analyze Salesforce data, providing users with actionable insights on sales, marketing, and customer service. You can create Salesforce reports and dashboards from these insights to better visualize the data.
Furthermore, you can also connect Einstein Insights with other Salesforce tools like Einstein Analytics and Sales Analytics. For example, Einstein GPT helps you build interactive visualizations from these insights. By regularly checking your dashboards, you can track progress and update your strategies to stay on target and improve results.
- Dashboard Builder
The Dashboard Builder in Salesforce lets you create dashboards that display data from your reports. You can combine data from multiple reports into a single dashboard to provide users with a comprehensive view of key metrics and trends. Next, employees can control the layout, colors, and widget sizes to match their needs.
Additionally, you can add filters to allow users to view data from different angles or focus on specific details. Dashboards update in real time, so users always see the latest data. They work on desktops, tablets, and phones. To build a dashboard, create your reports, open the Dashboards tab, and drag widgets into it. Then, link them to reports, adjust the design, add filters, save, and share them.
- Einstein Discovery
Einstein Discovery for Reports in Salesforce uses machine learning and statistics to uncover insights in your data. It presents findings with charts, clear explanations, and easy-to-read stories. This feature can help you quickly understand what’s happening in your business.
You can also explore past data to make predictions about future outcomes. Since Einstein Discovery works within Salesforce, you can use it in regular reporting tasks without needing to switch tools. It helps you discover hidden trends, understand key patterns, and make more informed decisions. You can also act on its suggestions and automate parts of your analysis and reporting.
- Reporting Manager
Reporting Manager helps Salesforce administrators manage, organize, and clean up standard and custom reports. It lets users archive, delete, and move reports to different folders with ease. Admins can select folders to archive, specify a destination, and schedule these tasks to run regularly.
Furthermore, the app allows users to view report details, including the last run date, filters, type, subscriptions, and usage counts. It also displays dashboard data, helping users keep everything organized. Report Manager Pro works with Sales Cloud and supports all report types, including scheduled and subscribed reports. With this technology adoption, admins save time and manage reports more efficiently.
6 Top third-party Salesforce reporting tools
Third-party Salesforce reporting tools provide more advanced features than native Salesforce reports. These tools help users analyze data, visualize trends, and integrate with other systems.
This results in clearer insights and better decision-making. They also allow users to customize and automate reports, making it easier to meet specific business needs.
Here are the third-party tools with Salesforce that can make reporting easier:
- SplashBI
SplashBI is a sales analytics platform that utilizes Salesforce to help users gain a deeper understanding of their data. It offers pre-built reports, dashboards, and visualizations, and lets users drill down from summaries to detailed data or open specific Salesforce records.
Your employees can create custom reports and dashboards tailored to their specific needs. SplashBI connects directly to Salesforce, allowing quick setup and data access. Its self-service tools let users explore and analyze data independently, without relying on IT.
Additionally, the platform offers mobile access, allowing users to view insights on the go. With its AI tool, Mira, users can ask questions and receive data-driven answers.
- Tableau
Tableau helps users create interactive dashboards and reports to explore Salesforce data in a visual and easy-to-understand way. It uses AI and machine learning to automate tasks, enable predictive analytics, and suggest next steps through tools like Einstein Discovery and Ask Data.
You can connect Tableau directly to Salesforce and analyze data without complex steps. Additionally, Tableau enables users to explore patterns, create visual stories, and share their findings. It offers more flexibility than standard Salesforce reports and effortlessly handles complex data relationships.
- Zoho Analytics
Zoho Analytics is a data analytics platform that integrates with Salesforce, offering advanced reporting and analysis tools. Employees can create various reports, including charts, pivot tables, and summary views.
You can also adopt Zoho Analytics to connect to multiple data sources, including other Zoho apps and external databases. The Salesforce connector enables easy import and analysis of CRM data. Users can also share reports with their teams, collaborate, and access insights on mobile devices.
Lastly, its AI-powered features can automatically identify trends and generate insights. This can improve your sales pipeline analysis, forecasting, lead analysis, and performance tracking.
- Domo
Domo is a business intelligence (BI) platform that connects and visualizes data from Salesforce and other sources. It enables users to create interactive dashboards and reports, allowing them to explore data and visualize key metrics.
Next, Domo provides various visualization options, including charts, graphs, and maps, to present data. Users can automate reporting by scheduling reports and setting alerts for data changes.
Then, Domo supports cross-functional collaboration, making it easy for teams to share insights and information. With built-in tools for data cleaning and transformation, Domo simplifies data management. Its drag-and-drop interface allows users to create reports, ensuring data security.
- Klipfolio
Klipfolio is a cloud-native platform that helps you create custom dashboards and reports for Salesforce data. You can connect it to your Salesforce account, including Salesforce Sandbox, to access and analyze your data.
More importantly, Klipfolio offers pre-built metrics and visualizations to help you start building dashboards. It enables you to create interactive dashboards that users can explore and drill down into for more detailed information. You can share dashboards with your team through email, links, or other platforms.
Next, Klipfolio allows you to schedule and automatically send reports. It improves data visualization and increases collaboration while reducing reporting time.
- Databox
Databox is a business analytics platform that acts as a reporting tool for Salesforce CRM. It lets users visualize, analyze, and report on their Salesforce KPIs and other data. Users can create custom dashboards to track progress and identify trends. By consolidating data from multiple sources, Databox helps businesses make informed, data-driven decisions.
Additionally, it enables teams to understand their performance data, leading to more effective strategies and improvements. The platform automates reporting, allowing users to schedule and share reports with their teams. Finally, Databox integrates with various marketing and sales tools to improve the user experience.
Data-driven decisions begin with the right Salesforce reporting tool
A Salesforce reporting tool connects directly to multiple data sources, letting teams gather all their data in one place. This eliminates the need to manually collect and combine data, saving time and enhancing accuracy. Native tools are well-suited for basic reporting, particularly for small teams utilizing the Lightning platform. As data needs grow—like cross-object analysis or real-time dashboards—teams often turn to third-party tools.
IT leaders should consider security, system fit, and future growth when choosing tools. The most effective approach combines native and third-party options. This empowers both technical and non-technical users to create useful, reliable, and strategic reports.

FAQs
A Salesforce reporting tool is a feature that helps users pull, organize, and analyze data. It enables you to create reports and dashboards, providing insights into sales, customer relationships, and other key metrics.
Salesforce reporting tools create reports and dashboards that show sales, marketing, and customer service data. They help track key performance indicators (KPIs), analyze deal performance, and identify trends to improve processes, achieve goals, and drive business growth.
To choose the right Salesforce reporting tool, businesses should define their reporting needs, assess how well the tools integrate with Salesforce and other systems, and consider factors such as staffing, cost, and business goals.

