Businesses implement software to solve problems. The problems might be around efficiency, accuracy, and scalability, among many other issues. But high-tech solutions may introduce another problem. What happens if no one uses the digital solution? Or what if the new users don’t use all the relevant features for their jobs?
For these problems, user adoption metrics help digital leaders understand the human side of their digital adoption strategy. In this article, we’ll show how metrics can go a long way to improving the value you get from software investments.
This article will explain the meaning of user adoption metrics and examine the major benefits of using user adoption metrics. Then, we’ll explore the following eight metrics with a proven record:
- Onboarding rate
- Engagement with training
- Time to first action
- Feature adoption
- Support tickets raised
- Active users per license
- Average process time
- User satisfaction
User adoption metrics are a vital part of your efforts to measure digital transformation. Clear and detailed information for these metrics will help you organize interventions that shape the user experience for the better and help you realize the full value of your software investments.
What are user adoption metrics?

We talk about “user adoption” to refer to the take-up of digital products in an organization. Just because you’ve shown your employees new software packages doesn’t mean they will use it! And even if they are using it, you don’t know whether they will use it to the maximum of its capabilities.
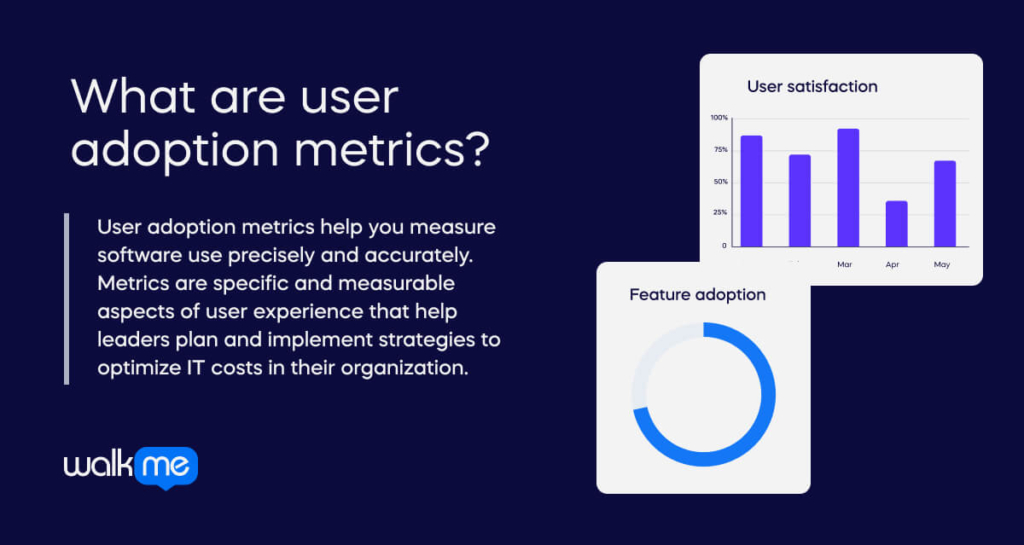
User adoption metrics help you measure software use precisely and accurately. Metrics are specific and measurable aspects of user experience that help leaders plan and implement strategies to optimize IT costs in their organization. User adoption metrics don’t tell you everything about digital adoption, but they give a wide range of insights that create a compelling narrative of software usage in a large organization.
User adoption metrics are an important part of any digital transformation project. They help organizations understand whether their new digital systems are working effectively, realize a good ROI, and improve overall business outcomes.
In this context, the idea of “user adoption” is different from ideas like “the adoption curve” or the “technology life cycle.” These are useful ideas for other aspects of digital use, but they are separate from user adoption within an enterprise organization.
What are the benefits of user adoption metrics?
When you roll out a new digital system, the technical details are only part of the process. Effective monitoring is essential to ensure success. Regardless of how meticulously you plan a digital transformation, you must seek assurance that it has worked. That’s where the benefits of user adoption metrics come to life.
For leaders, user adoption metrics offer many valuable insights.
The metrics help leaders establish Key Performance Indicators (KPIs) for the financial investment made in the new system. This information provides a tangible measure of the return on investment and serves as a foundation for planning future digital transformations.
Leaders can use these metrics to identify weak spots in training, facilitating targeted interventions to enhance overall workforce competency. Furthermore, user adoption metrics offer leaders an objective view of the usefulness of the implemented changes.
On the other hand, users also enjoy the benefits of user adoption metrics.
The metrics create a platform for users to articulate their needs, allowing organizations to address concerns and optimize user experience. Importantly, if the software fails to meet user needs, user adoption metrics empower leaders to make informed decisions about software efficacy. Leaders, ideally, become willing to dispense with weak solutions and explore alternatives that better align with user requirements.
Now that we know the benefits of user adoption metrics, let’s look at our eight top measures of organizational software use.
1. Onboarding rate
The onboarding rate measures the effectiveness of setting up employees with the application. It assesses whether users click on the application and complete the setup process. This metric is valuable for understanding the initial adoption phase, indicating user engagement levels.
A high onboarding rate signifies active engagement, while a low rate may indicate usability issues or a need for clearer instructions during setup. Understanding these behaviors helps refine the onboarding process for improved user adoption.
Knowing the onboarding rate will help leaders address identified barriers or confusion in the onboarding process. It means users don’t need to fall at the first stumbling block.
2. Engagement with training
Metrics about training engagement assess how far your employees have the necessary skills to use the software. Employee training gives users the vital first step in using new software. And if they’re not taking that step, it’s time for leaders to intervene.
This metric helps understand the commitment and receptiveness of users to educational content. It doesn’t directly show whether or not people are using a product, but indicating their preparedness acts as a useful proxy. There are various ways to find out about user engagement with training. For example, through learning management systems, track completion rates, and user feedback from surveys.
Understanding engagement with training allows for targeted improvements in educational materials. Organizations can refine training programs by identifying areas where users may disengage or struggle to better suit their employee’s learning styles. Improving engagement with training contributes to enhanced user competency and, consequently, higher overall user adoption.
3. Time to first action
You can build on onboarding metrics by measuring the time-to-first-action. This measures the speed at which users take their first meaningful step with the application after completing their onboarding.
Time to first action gives insights into user perceptions of the application. If they start using the application quickly, it shows they understand the benefits and want to use the software quickly to solve problems. This metric also attests to the effectiveness of your training and onboarding process, highlighting opportunities to improve every step along the way.
Organizations can enhance user satisfaction by reducing the time it takes for users to experience the product’s value. This approach increases user adoption by ensuring a swift and positive user experience, encouraging users to explore and utilize the product more effectively.
4. Feature adoption
Feature adoption assesses how far users engage with specific features within an application. It provides insights into which features are actively used and highlights areas for potential improvement or promotion.
To understand this metric, you can use feature analytics tools that track the usage of individual features. Analyze user feedback to comprehend preferences and identify pain points related to specific functionalities.

This metric reveals patterns in feature adoption and helps leaders make good decisions about feature enhancements. It also enables organizations to focus on popular features and address issues with less-used functionalities.
By continuously monitoring and optimizing features based on user behavior, organizations can enhance the overall user experience and drive sustained adoption.
5. Support tickets raised
Support tickets raised indicate issues reported by users. It shows how many problems your employees have with the products. Understanding this metric helps organizations gauge user pain points and challenges, providing insights into areas of the product that may need improvement.
To learn about this metric, analyze customer service ticketing systems. They can then proactively address issues, reducing friction and enhancing the overall user experience.
Support tickets can tie in with a far wider range of customer experience metrics, including ticket deflection.
6. Active users per license

The number of active users provides a valuable snapshot of user engagement. It helps your organization encourage more software engagement and feeds into license management work.
To gain insights into this metric, analyze user activity data and calculate the ratio of active users to licensed users across different time intervals. Organizations can strategically enhance user engagement by comprehending user behavior through active users per license. Targeted interventions during periods of low activity can re-engage users, contributing to an overall improvement in user adoption rates.
7. Average process time
As a metric within business process optimization, average process time gauges the time it takes to complete a specific task or process. This metric is fundamental in evaluating the efficiency and effectiveness of software to achieve a good ROI.
To learn about this metric, you should gather time-tracking data associated with various business processes. Identify bottlenecks and inefficiencies by comparing the average process time across different stages.
Understanding user behavior through average process time is crucial for optimizing workflows. If the software does not reduce the average process time, you must investigate how to improve it. Organizations can improve overall productivity and user satisfaction by thoroughly optimizing every business process.
8. User satisfaction
User satisfaction is a metric that evaluates users’ overall experience with a product.
This metric is far more subjective than some of the other metrics we’re discussing in this article. However, it is still highly relevant. Any experienced change leader knows that employee resistance is one of the most crucial barriers to the success of a new initiative. Digital implementations are no different. If staff don’t like the solution, you will struggle to get the most out of your software ecosystem.
To gauge user satisfaction, conduct online surveys, organize focus groups, and conduct interviews to gather qualitative and quantitative feedback. Analyze this feedback carefully to understand user sentiments and perceptions about the product or service.
Understanding user behavior through satisfaction metrics helps organizations identify strengths and weaknesses in their offerings. By addressing user concerns and building on positive aspects, organizations can enhance overall user satisfaction, fostering a positive environment for increased user adoption.
Final thoughts: Gathering adoption metrics
Implementing software solutions is a strategic move for businesses aiming to address various challenges, from efficiency to scalability. However, the true value of these solutions lies in their effective user utilization. User adoption metrics play a crucial role in deciphering the human side of digital adoption strategies, offering insights that enhance the value derived from software investments.
If you want to gather this information, one of the best tools to go for is a Digital Adoption Platform (DAP). This is a relatively new category of software. DAPs support users in their adoption journey and provide valuable feedback to leaders.

A DAP like WalkMe can feel like yet another investment. But with the right metrics, they can make a huge difference to the ROI of every software investment.


