
How to measure leading vs. lagging indicators of your digital initiatives
Whether your organization aspires to be data driven (or to start, data informed) , one of the hardest aspects of developing an analytics strategy is to define lagging and leading indicators. Quick definition (we’ll dive deeper later):Lagging indicators define success, while leading indicators predictably measure progress along the way.
According to Harvard Business Review, 49% of executives indicated that analytics are critical to measuring the success of their digital initiatives. But what exactly needs to be measured isn’t always apparent.
So how should you measure the success of your digital initiatives? Let’s dive into the metrics high performing teams use to ensure they’re on the path to success.
Leading vs lagging indicators to measure your success
So, what are most organizations measuring to actually define and measure success? Let’s take a look at some of the top metrics used by digital transformation executives.
- 36% customer review and feedback
- 35% company revenue
- 32% speed of new technology implementation
(source: CIO Outlook 2021)
These indicators, often tied to revenue or margin, have an important role in calculating the outcome of projects in a spreadsheet, but they often miss the mark when trying to identify real impact across the organization and how it affects your employees.
By the time the usual lagging reporting comes into play, it’s too late to have an effect on the outcome and maximize the invested time, energy and resources into a project. It’s a real problem for transformation and technology professionals. But it’s a problem we can help solve.
That’s why digital transformation has to start with metrics, planning, and data along the way. Let’s introduce you to the yin and yang of data points, leading and lagging indicators.
Why both? Well, let’s say you and your friend Sue decided that this was the year you were going to run a marathon. No simple feat, and one which requires a tremendous amount of training. So, you and Sue both commit to training 4 times a week for the year leading to the big race.
It’s the day of the race, you’ve both done it, trained 208 times, and now, it’s time to run 26.2 miles like the crazy humans that you are. How are you going to do? If you feel like you need more information, you’re thinking about it the right way.
Measuring for outcomes with lagging indicators
Lagging indicators, while slow to the race, are critically important. Lagging indicators provide a current view of the business by analyzing backward looking data. They also are usually tied to top-tier initiatives that connect to the expected value of your project. By defining the right lagging indicators, you’ll be able to gather alignment cross-functionally to set clear and reportable goals. It also makes it easy to ensure you’re speaking the same language with other teams.
Examples:
- Annual revenue
- NPS
- Customer churn rate
- Number of trainings completed
If we think about you and Sue training for the race, it’s great to see that the goals were met and completed on time. It helps track progress, and also ensures there’s an alignment between multiple parties (or teams) on what needs to be done.
Measuring for progress with leading indicators
Leading indicators should be frequently updated in order to predict a future state. By using data representative of the current timeframe, they are indicative of how outcomes may be affected in the future. By identifying the right leading indicators, you can measure progress towards your goals, as it’s happening, allowing nimble and outcome-driven teams to predict success, identify challenges along the way, and make changes in the moment to ensure broader long-term success.
Examples:
- Daily active users
- Cart abandonment rate
- Daily support tickets
- Miles per training & time per miles
Here’s the missing piece of the data story you need to predict outcomes. In this case, focusing on the predicted outcomes based on today’s metrics helps us understand what tomorrow will look like. If you’re training 208 times a year, but you aren’t measuring output, change (week over week), and completion metrics, you’re missing out on key data points for predictability. These are the leading indicators that allow you to ensure you’ll reach your goals, or inform whether or not you’re going to miss and need to make changes along the way.
Predict better outcomes: Use digital adoption metrics as leading indicators
When it comes to digital analytics, tools have been developed to measure advertising yield, eCommerce progress, and product adoption. Digital adoption metrics help teams take the best of these various evolutions of metrics and find the ones that are uniquely suited to digital adoption.
When it comes to being able to accurately predict outcomes, think about measuring Reach, Engagement and Activation.
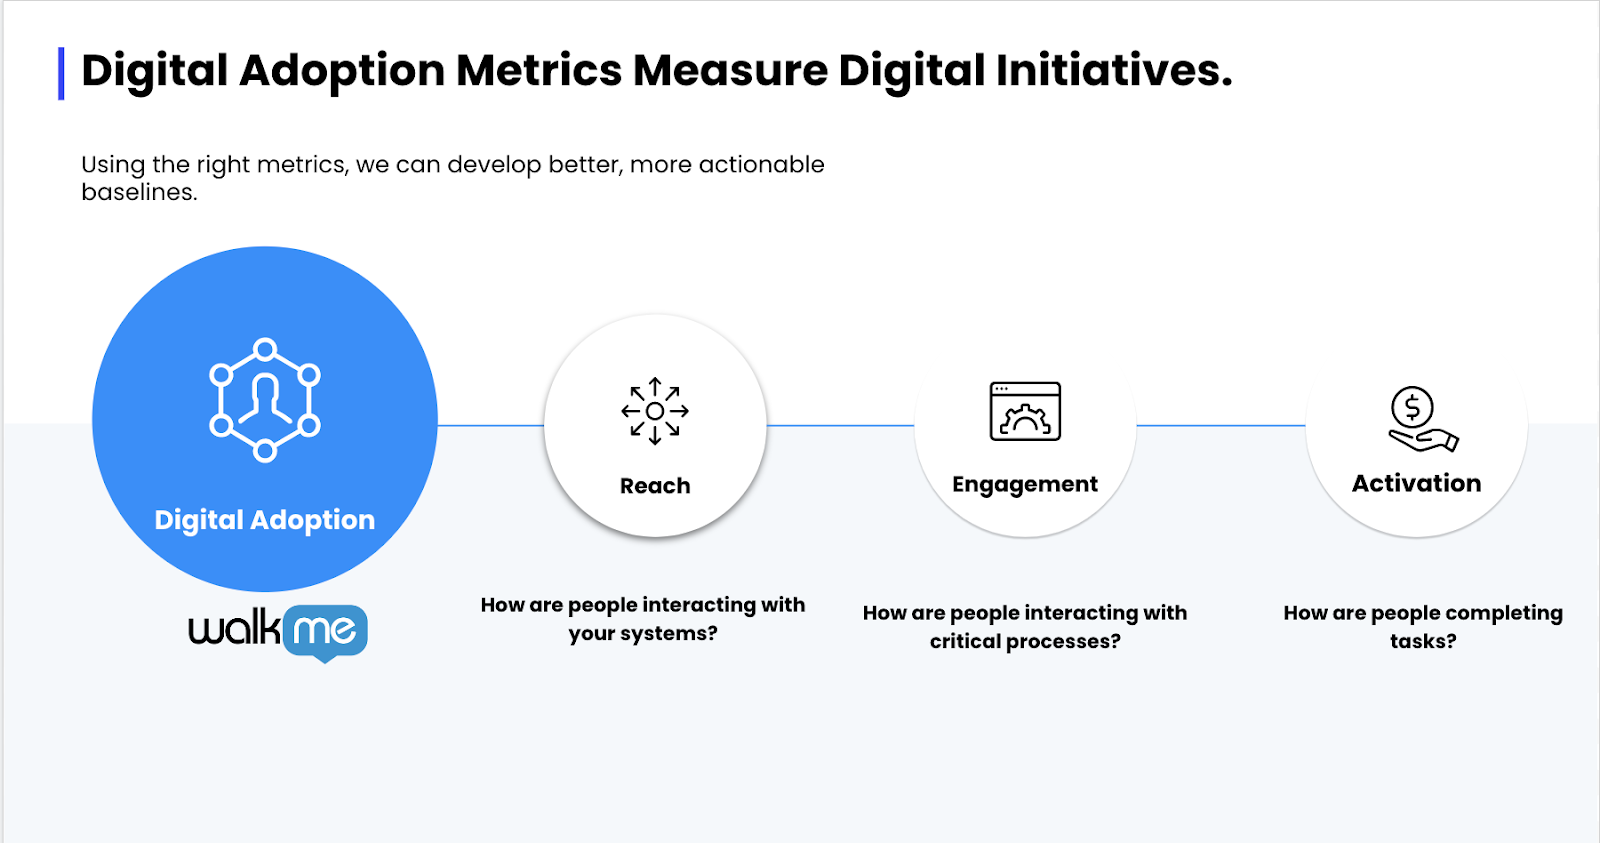
Reach: How are people interacting with your systems?
- Daily active users per platform
- Week-over-week change in users per platform
- Monthly log-ins per team
At the most basic level, teams that are rolling out new systems need to ensure that those tools are being accessed and used in the first place. Perhaps you’re relying on a communication plan to promote the new tool using email, Slack, or Workstation. When doing so, you can measure the effectiveness of that communication by defining your reach metric.
Where to Start: Start by measuring daily active users (DAU) especially for a new platform roll out. Measure change over time to understand how and when platform adoption starts to succeed.
Engagement: How are people interacting with critical processes?
- Feature interaction rate
- Week-over-week change in interaction rate
- Single session completion rate
- Process abandonment rate
If your system is more complex, perhaps a CRM, or an expense management system, you’ll want to make sure you’re measuring the actual process, and not just system access. Perhaps you’ve rolled out a new expense management process that people will need to learn. By measuring process initiation, you can ensure people are able to find the initiation point, navigate to the right aspect of the system, and get to where they need to go. If you’re not measuring engagement, you won’t know if there’s an opportunity for improvement.
Where to Start: Start by measuring feature interaction rate to baseline how often people are finding their way to the feature. From there, you can think about % of population as you drive broader awareness.
Activation: How are people completing tasks?
- Completion rate by team
- Time to complete
- Decrease in time to completion
At its most critical, activation is your metric to measure whether or not people have learned a new process, or completed a critical milestone. The concept of activation, borrowed here from Dave McClure’s growth-hacker manifesto, is the key metric that apps like AirBnB, Uber, and Facebook use to measure long-term platform adoption. Uber defined it as a user’s first ride. AirBnB a first booking. If you’re rolling out a new process, or system, take a minute to think about what ‘success’ looks like from the user’s point of view.
At its most basic, it’s a measure of completion, establishing a metric to understand in real time, whether or not your users are able to complete a critical task. Whether it’s updating a forecast, or completing open enrollment, getting the process completed, is the very nature of why your system is put there in the first place. Measure it.
Where to Start: Start by measuring process completion of the most high-impact process in a system. Not sure if it’s high impact? Find a process that affects a lot of people or has a high financial impact (ex: related to compliance or revenue).
Lead with purpose, lead with data
Remember – Digital adoption metrics provide a glimpse into what’s happening under the hood of your platforms as they’re being rolled out. Beyond the typical measures used to measure ‘done’, digital adoption metrics help you better quantify actual adoption of your systems, processes, and tools that you’ve invested so heavily in already.
Historically, this level of analytics was only available to marketers or product teams which is why technology teams were forced to rely on disconnected metrics of success. That’s no longer the case with modern digital adoption tools. Now, from the moment you go live with a system, tools are available for you to answer the questions that matter most to your organization – did it work?
Measuring “did it work” isn’t just interesting for senior executives, but also helps connect the dots to the teams and people that are invested in delivering the successful project. It also helps teams identify their purpose and teams that have purpose perform better.
So the next time you’re rolling out a new tool or system, don’t lag on defining your outcomes. Lead with purpose, lead with data, and lead with leading indicators to measure success.
How to get started with your next WalkMe Project:
- Connect with other people on our LinkedIn group: Digital Leaders in Operational Excellence